For the last few days we’ve been preparing internal reports twice a day for staff. We’ve decided to release these publicly to help you plan.
US cases are at 52,900, up from 42,400 yesterday morning. New York state makes up nearly half, coming in near 26,000 alone. New Jersey is the state closest behind at 3,700. Both of these are still on a very steep curve upward.
Tennessee is up to 667 cases from 615 yesterday. Knox county officially moved up to 13 from 12. We expect that the real number is a lot more.
We’re dropping the AM updates until there is new news. The last few mornings have just been more cases, more shutdowns, more crazy stock markets. We expect more of the more.
Where are we at?
Yesterday we went over a rudimentary model that said cases are following a curve that is:
y =91e0.3026x
In not-math language means that cases are increasing each day, by an increasing amount. If the number of cases is our speed then the curve says we are going faster faster.
As a whole, the US actually overshot the curve which predicted 52,440 cases today. The day isn’t over and we’re north of 52,900. Half of those are still in New York, which is coming up on 26,000 cases. New Jersey is second at 3,600 cases.
The above is meant to give you an idea of how fast things are progressing. Can you remember what you were doing a week ago Wednesday? US cases had started to surge but unless you were in NYC, LA or WA you might not have been paying much attention. Today’s case count is off of the chart compared to what we were using 2 days ago.
Let’s forecast that out 7 days again:
Again, don’t take our Excel forecasts as deep expertise. These are quick and dirty and there are a lot of factors at play. Here’s the rub, if nothing changes then this forecast is probably more right than wrong. Also, because New York has so many cases it may overweight the series.
Alright, what about Tennessee?
Hey! Who likes good news? Our forecast says we should be 1,000 cases and instead we’re only at 667. This is exactly what flattening the curve means. For Tennessee, one day isn’t enough to declare victory. Why it dropped mattered and we — at JM Addington — don’t have enough information on the underlying testing to determine why it dropped. Maybe we just tested all the sick people up front and now we’re on to healthy ones. Maybe we hardly tested at all today. Maybe the labs were just late reporting their numbers.
All of the graphics we’ve shown so far are total cases, they can only go up. Of course, the thing we really care about is active cases, who is sick today. For active cases to decline we need people to get better or die faster than new people are getting sick.
Here is China on both of those counts:
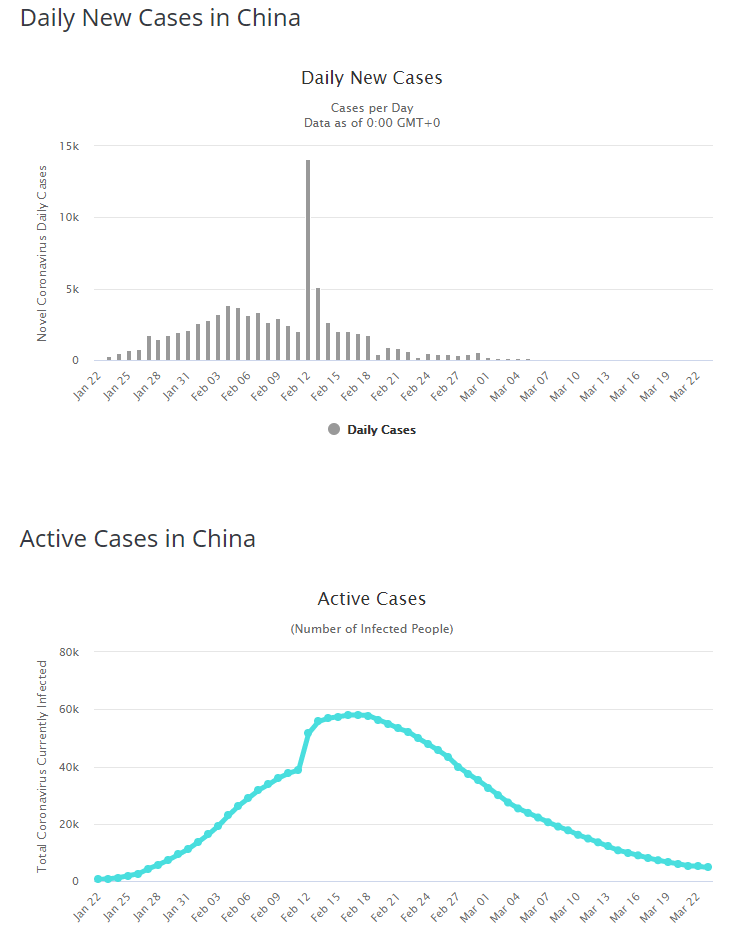
Ignore the one giant spike. China began hardcore lockdown January 22, by early February new cases started dropping and by mid-February total cases were in decline. That is flattening the curve.
Italy is also showing evidence of flattening the curve:
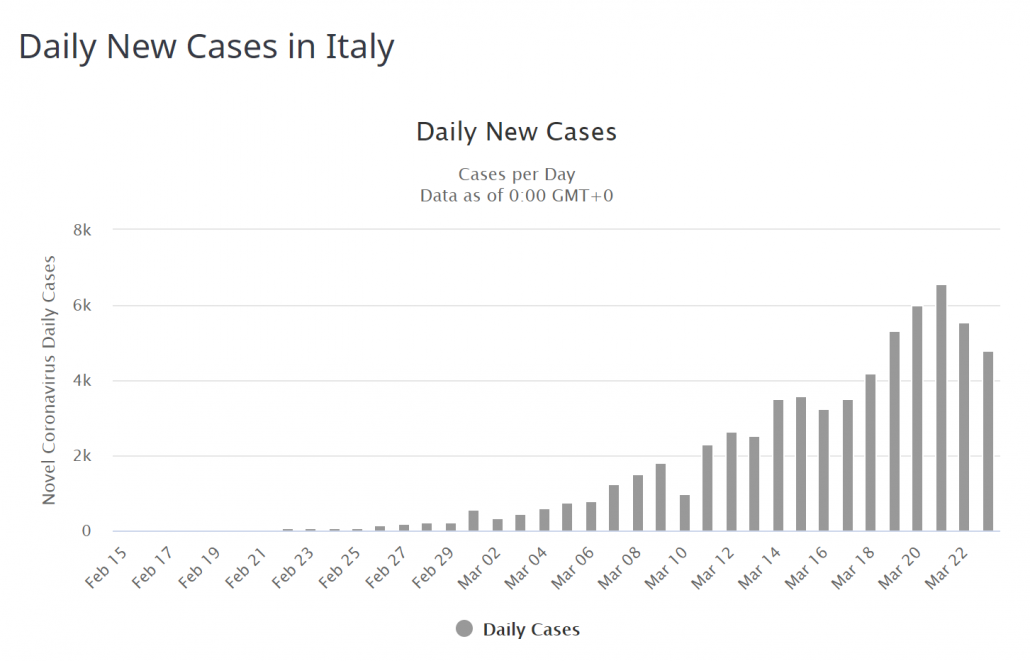
March 24th will probably show an increase from March 23rd, but below the peak. Italy is a top place to watch because they are entering the critical period where the expectation is for the curve to flatten. If it doesn’t there will be important questions as to why not.
Why is this a big deal?
It’s not clear to a lot of people why COVID-19 matters. OK, so it’s a deadlier cousin of the flu, why don’t we just go about daily business like they did in 1918?
Well, first, to state the obvious it isn’t 1918. In 1918 it took weeks to cross the ocean, not a few hours. We were barely driving (less than 0.2 cars per person) and we didn’t have freeways. In 1917, the year before the Spanish Flu, the life expectancy in the US for men was 48 and women 54.
We could go on but you get the picture. 1918 isn’t a good comparison.
Let’s talk about systemic failure, points I am going to largely summarize from Tomas Pueyo.
What is systemic failure? The failure of a system. When your power goes out, that is an incidental failure, a storm brought down a pole, the pole gets repaired and your street gets power back on, not a big deal.
When your entire state has rolling brownouts because (1) it is hotter than normal increasing demand, (2) the grid can’t redistribute electricity fast enough and (3) local providers are unable to increase supply fast enough you have a systemic failure. The whole thing is broken.
That’s what is happening in Italy, and what Gov. Cuomo of New York is so concerned about.
The curve for New York looks just like the curve for the US above, except that it is only half as far along (26k cases instead of 53k). 7-8 days out looks like nearly 300,000 people infected. As of yesterday, about 1 out of 8 COVID-19 positive New Yorkers were being hospitalized for the virus. That comes out 37,500 hospitalized in New York state alone a week from today.
The state only has 50,000 hospital beds and, guess what? They already use most of them in non-pandemic times. Only 3,000 of those 50,000 are ICU beds. “Health officials estimate that the state will need 110,000 beds and 18,000 to 37,000 ICU beds.”
Let’s assume that they can’t get that many beds (6x ICU beds at minimum) inside a week, or even two. Then what happens?
The hospitals get completely overrun. As they get overrun, doctors, nurses and other healthcare workers in the highest demand ever start to get sick, and some die. Possibly while cases are still increasing as a whole. So the demand on the system is past its capacity and its capacity starts to shrink in response.
We can run the same scenarios for ventilators and oxygen machines but it amounts to the same thing. Our healthcare system isn’t built to handle a once in a hundred years pandemic.
As the system is overrun the mortality rate increases because of the shortage of beds, staff and critical machinery. People die that would not have otherwise because there just isn’t enough to go around.
And it won’t just be COVID-19 patients. Anyone who needs access to doctors, nurses, ventilators, etc., will find them hard to come by. 20 year old in a car wreck needs a ventilator? Get in line. Have a current medical issue that is manageable but needs management? Get in line. Every sick person that exceeds the capacity of the healthcare system has a higher chance of dying than when the system is operating within capacity.
In IT we call this a cascading set of failures, as a failure in one area causes failures in other areas, like dominos.
This, of course, would not last forever. Eventually, it would die out. However, it’s really hard — maybe impossible — to estimate what the cost and impact on society would be.
This also is at the heart of “flatten the curve,” the entire idea is to keep cases within the capacity of the system. Plus, the math of exponential growth is that the faster you cut off exponential growth the less pain you have to go through.
Headlines
Gov Bill Lee calls for Schools to be off until April 24th. We applaud the governor for finally making a call that parallels our reality, even if it isn’t popular. Our $0.02: we still think that’s tad optimistic but we’ll watch the data. If our TN curve stays flat then we just might be able to have life back to kinda normal in a month.
India is entering lockdown. We are unable to keep up with the number of states in shutdown, or in some level of shutdown. The NYT is tracking that well.
There are prominent voices talking about when to end the shutdowns. Our read is that the facts on the ground are guiding actual policy over what we wish was happening. NY, the US, and the UK have all reversed course at this point after the number of cases spiked.
Bill Gates still thinks we’re on a 6 to 10 week shutdown time horizon.
The Smokies are closed: this isn’t a surprise. If you follow Tennessee’s progressive shutdown, the “next” place is continually where people go to after the last place was shutdown.
Two Sunday Required Reads
I’m reposting this, you really should read through both of these to understand why we’re all staying at home.
“The Hammer and the Dance” does an amazing job mapping out our different options on how to react to COVID-19. A completely separate effort from academia, highlighted in the NYT, reaches the same conclusion,
How We Are Adjusting
Our time horizon is still floating at 6 to 10 weeks out. We’re beginning to feel that ten weeks may be optimistic based on the slow measures taken by the majority of the country.
Our biggest adjustments ahead will depend on where we believe cash will be in 4-5 weeks. We don’t believe we will have adequate visibility into late April until later this week.

Download our Report!
Get your copy of What Every Business Owner Must Know About Hiring an Honest, Competent, Responsive, and Fairly-Priced Computer Consultant.