US cases are at 83,200, up from 65,650 yesterday. New York continues to make up about half of those cases, with a significant jump in New Jersey.
Tennessee is up to 957 cases from 784 yesterday. Knox county moved up to 28 from 20. We continue to expect that the real number is higher.
Before we jump into anything else let’s mention the one thing we won’t talk about yet: the stimulus bill. It’s passed the Senate but not the House. We know that there are calculators and bill run-downs already. It’s still a bill and not a law.
Update Summary
US cases are up, a lot, half still in NY which isn’t really slowing down yet. Italy, at best, is easing up on the gas pedal, definitely no brake. The Department of Labor has a summary page on the new required COVID-19 sick leave. We take some time today to explain how to understand cases, deaths and hospitalization rates together, instead of separate.
We’re going to continue to back off on the things that are not new: the US will have lots more cases tomorrow and so will New York. We’ll do our best to shift our focus in time forward to what happens next.
Different Numbers and their Relevance
Let’s take a minute to talk about the different terms and statistics that are getting thrown around. First, we have confirmed cases, which is, exactly what it sounds like. The number of cases we know that we know. The problem with cases is that (1) tests take 4-7 days for results and most people still aren’t tested without symptoms, so there is an inherent lag between confirmed cases and actual cases, (2) without randomized testing they really don’t tell us about the broader population. I.e., 83,000 cases in the US really don’t tell us the total number of people infected.
Second, is deaths. Deaths are important because (1) someone died and that’s the big thing we are trying to avoid, and (2) deaths don’t wait on a test to be counted. There is less of a lag. If you know the infection fatality ratio (IFR, deaths / actual cases) you can figure out roughly how many cases there are. For instance, if the IFR is 1%, one death would indicate roughly 100 cases more generally.
What we can do with confirmed cases and deaths is compare how the two are moving: if they are both going in the same direction that ought to indicate real progress. If they are moving in different directions that indicates an issue with the underlying data, or a lag at minimum.
Third, we have hospitalizations. These are important because (1) a high number of hospitalizations can overrun the entire healthcare system and drive up mortality rates across the population, not just COVID-19 victims, and (2) if you know the hospitalization rate you can, again, take a guess at the broader number of cases even if they aren’t tested.
Here is the real rub: the IFR and hospitalization rates are both calculated ratios that require you know at least 2 of the 3 numbers. I.e., IFR = DEATHS / ACTUAL CASES but we don’t know ACTUAL CASES, we know confirmed cases. Hospitalization rate has the same problem. The case fatality rate (CFR) is DEATHS / CONFIRMED CASES, and is the one ratio we can know, but we can’t extrapolate anything further from it.
There are real questions as to how big of a deal COVID-19 is or will be. There are some articles that try to answer that question by taking an IFR from another country and applying it to the US. For instance, if you look at Germany’s 0.6% CFR[1] and New York’s 385 deaths you might conclude that New York’s actual number of cases is closer to 65,000 rather than 37,000.
There are a number of people using this kind of math[2] to demonstrate that COVID-19 may not be as bad as is reported. We don’t think they are wrong, and we don’t think that they are right. We think that the unknown variables make it pretty much impossible to extrapolate from the data in this way. In other words, the guesses are about how big or small COVID-19 are right now are just that: guesses.
A couple of final notes for those of you reading headlines about fatality rates, Italy’s skews high because of the way they attribute deaths to COVID-19. China’s rates skews high as well because they didn’t count everyone who was infected as being infected. That means the generally reported 3.4% case fatality rate is the worst-case scenario based on current data.
So Where Are We Today?
US confirmed cases continue upwards. They’ve actually dropped below the trend line, which would be good if that was from a lower infection rate. It’s probably from test lags or not enough testing, or both.
Above will be the most interesting chart we have today, the height of that arrow is the same as the increase in cases in the last week. If we look at hospitalizations we find that follows a similar trend. Most of them are in New York (6,800):
New York continues to lead the US in cases by far and away. However, we can see both that all other US cases are increasing faster than New York’s, but New York isn’t doing great. The best you can say is that the last five days look better than the five before it, in terms of how fast things are accelerating. Our own notes are that New York went into shutdown on March 20th, meaning that “social distancing” effects to decrease cases shouldn’t be observed for at least another week.
Tennessee is in roughly the same bucket, but with far fewer cases:
It’s an interesting comparison, the exponential growth rates of both TN & NY are close to 0.36 but NY’s overall increase is about 20 times higher than TN.
International
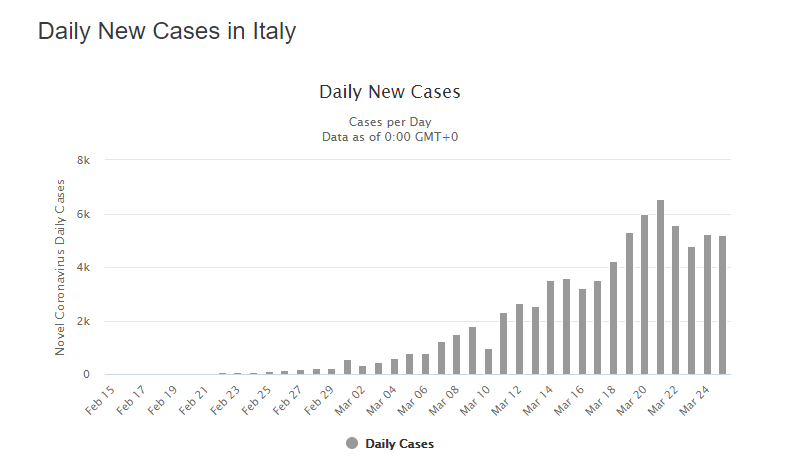
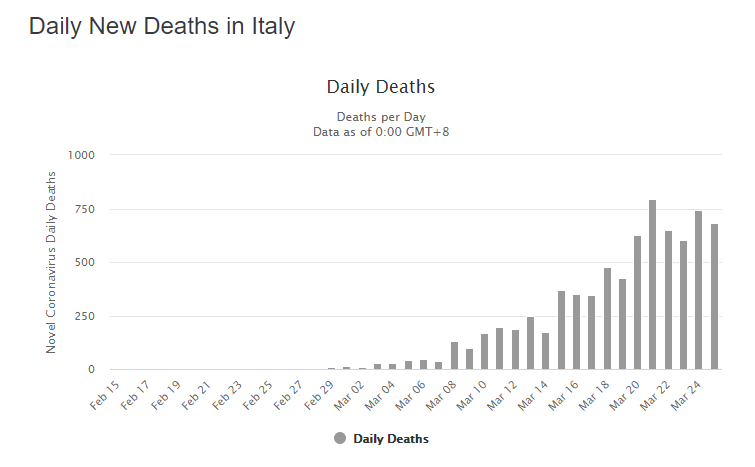
Italy’s new cases are going to come in at least at 6,200 for today. That’s not what we want to see. Deaths also are set to come in at over 700.
Remember earlier we said that cases and deaths moving in the same direction would indicate that’s really where things are going? If you overlaid the trend from the peak to today on both of these it would be only slightly pointed down to the right, so, decreasing, but not by much.
If there is a bright spot that data would still come out of China, where both new cases and deaths would have a similar trend after their peaks around February 15-18:
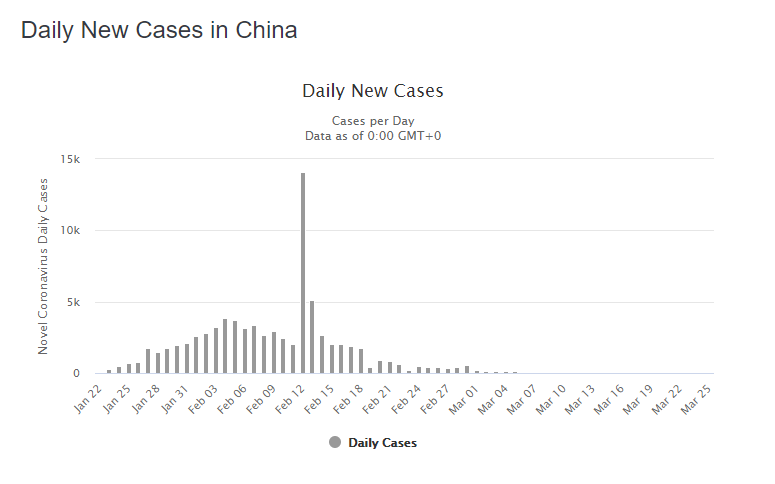
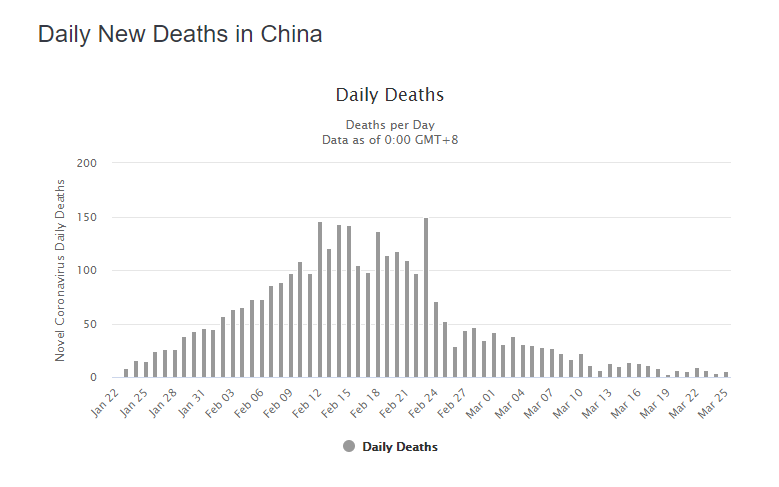
However, the caution here is two-fold: (1) we’re getting close to finding data to support what we want to see, and (2) China went into a much harder, more sudden lockdown than anywhere else we’re aware of.
Other Headlines
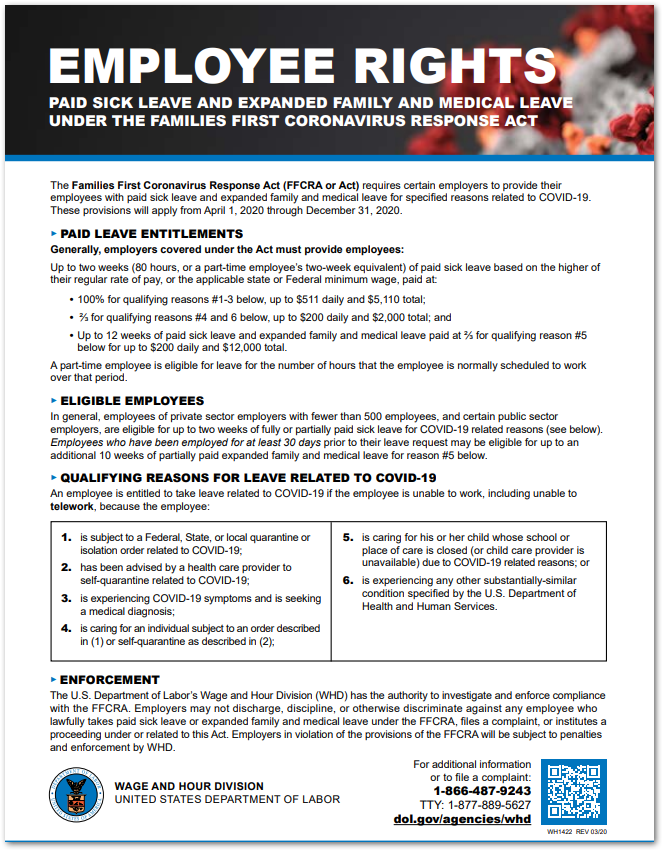
Families First Coronavirus Response Act: Employee Paid Leave Rights: The Department of Labor finally put up a great summary of what rights you have as a worker to paid sick leave related to COVID-19. In short, two weeks at full pay and 10 weeks at 2/3rds pay. If you have to stay home with the kid because school/daycare is closed that counts as well. Only applies to companies with less than 500 employees, companies with less than 50 employees can ask for an exemption if they’d go bankrupt following the law.
Companies: find a post for your breakroom Microsoft Teams channel here.
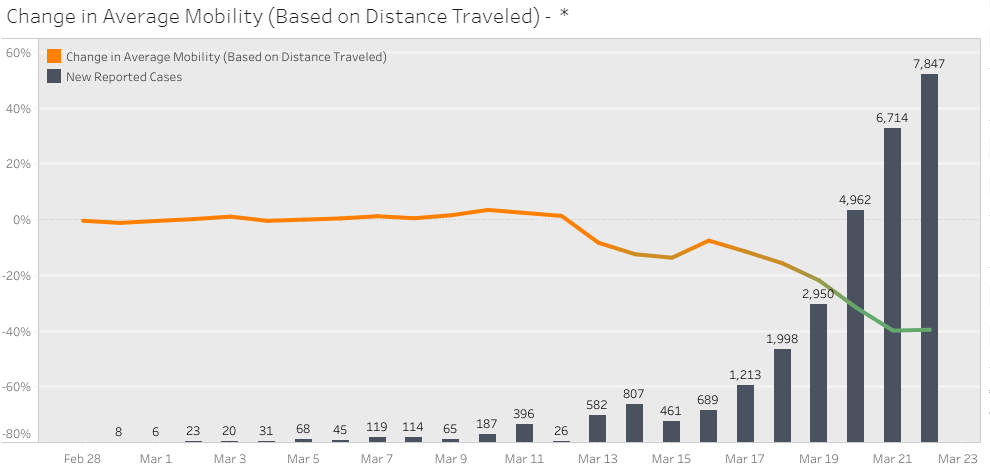
A private company called Unacast is combing “location data” [your cell phone data] to put together a dashboard on how well the US is doing with social distancing.
They grade the US a B. We think that’s optimistic if the target number is closer to -100%:
The big banks in California have agreed to a 90-day mortgage grace period. We believe that is incredibly significant and expect other states to soon follow suit in the same way they have issued stay-at-home orders.
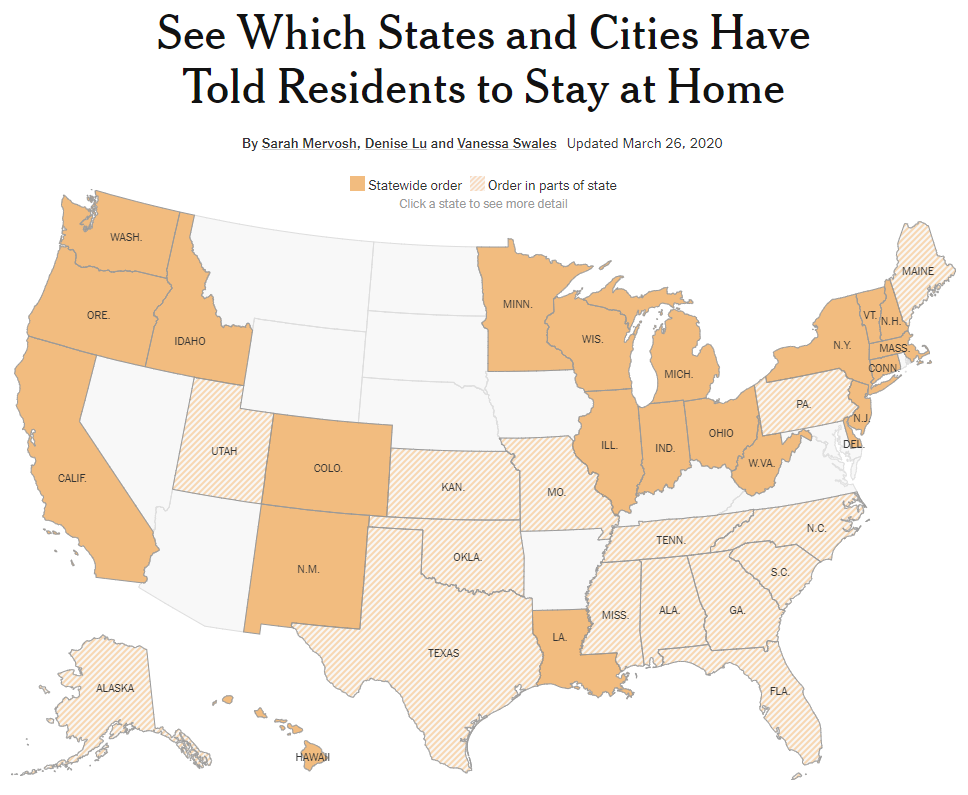
More states are shutdown, spoiler, almost all of them have something in place:
How We Are Adjusting
Our time horizon is still floating at 6 to 10 weeks out (so, late May at latest for the end to mass shutdowns). We’re beginning to feel that ten weeks may be optimistic based on the slow measures taken by the majority of the country.
Our biggest adjustments ahead will depend on where we believe cash will be in 4-5 weeks. We don’t believe we will have adequate visibility into late April until later this week.
Notes
[1] This is technically a CFR. However, the general reporting is that Germany has tested widely enough that their IFR and CFR are probably closer than any other population we have measurements for. [2] The linked article is calculating the IFR by estimating the total infections, which only shifts the uncertainty from one variable to another.
Download our Report!
Get your copy of What Every Business Owner Must Know About Hiring an Honest, Competent, Responsive, and Fairly-Priced Computer Consultant.