LATEST UPDATE IS HERE: https://jmaddington.com/2020/04/2020-04-05-covid-19-update/ – Some social media services re-wrote the link to yesterday’s update, below.
Today is a quick update, nothing too in-depth.
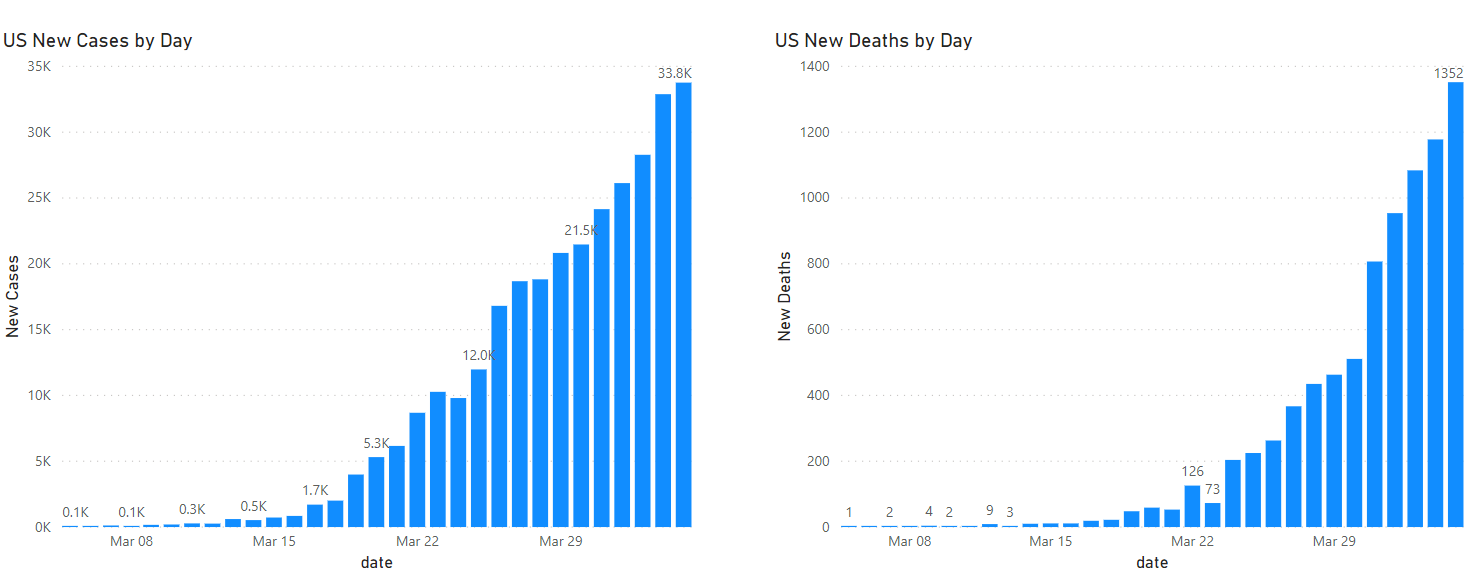
First, new deaths nationwide are still rising. New cases are hard to tell, the data isn’t all in yet for the day:
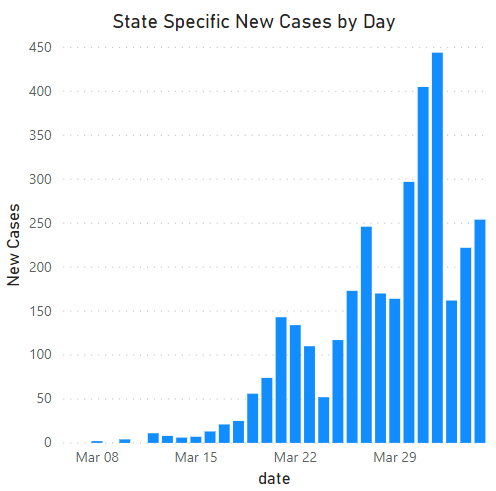
We saw some headlines today about TN cases “surging” past 3,000. While it’s true that we’ve topped 3,000 total cases, TN new cases today are about the same as the average for the last 7 days and down from the middle of this week.
We saw some headlines today about TN cases “surging” past 3,000. While it’s true that we’ve topped 3,000 total cases, TN new cases today are about the same as the average for the last 7 days and down from the middle of this week.
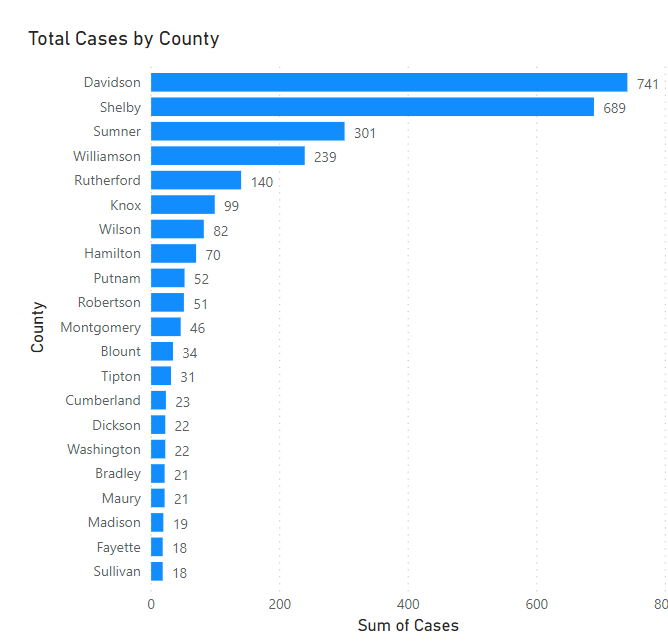
Middle Tennesse, especially around Nashville, continues to lead cases, by far and away.
Davidson, Sumner and Williamson counties make up 38% of all TN COVID-19 cases statewide. Knoxville’s 99 cases contribute 3.26% to the total.
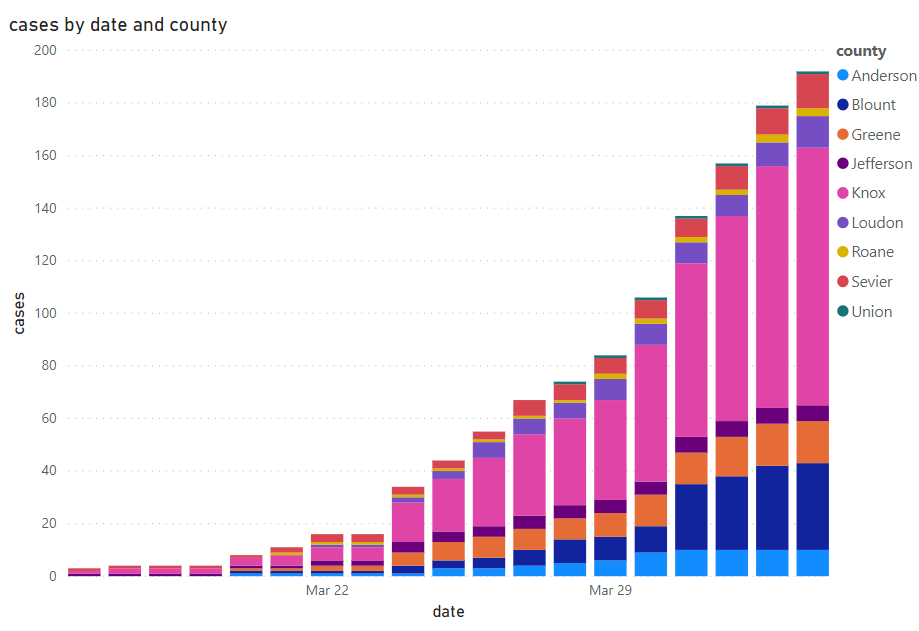
The nine-county area around and including Knox County remains at under 200 total cases. We haven’t run a formal regression on this but visually the number of new cases per day appears to be decreasing.
More broadly you can see where the US is on the curve, at least as projected by IMHE:
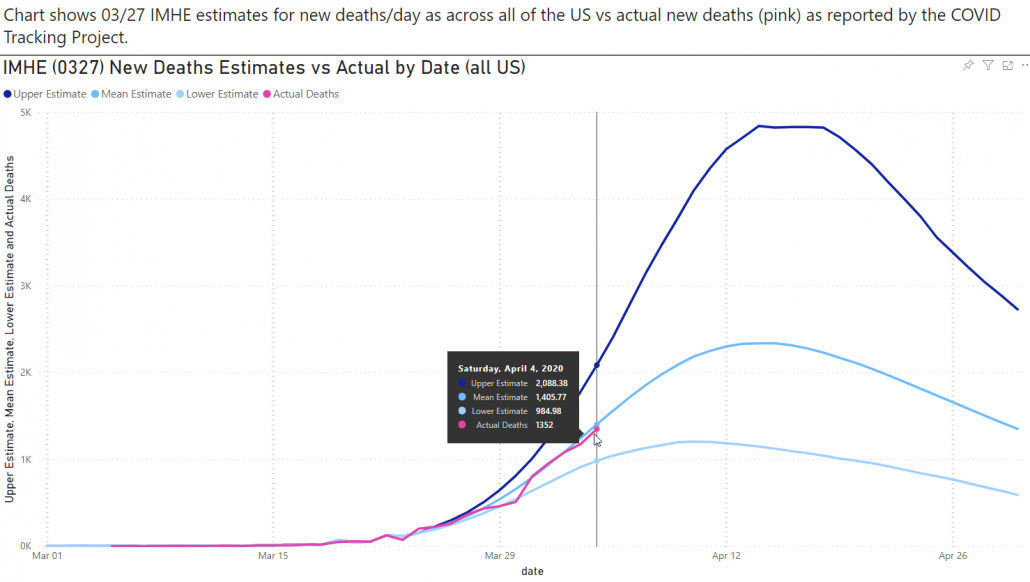
We are a week out from the date this model was made it is holding up well. The peak, however, still predicts the number of new deaths per day in the US doubled compared to today.
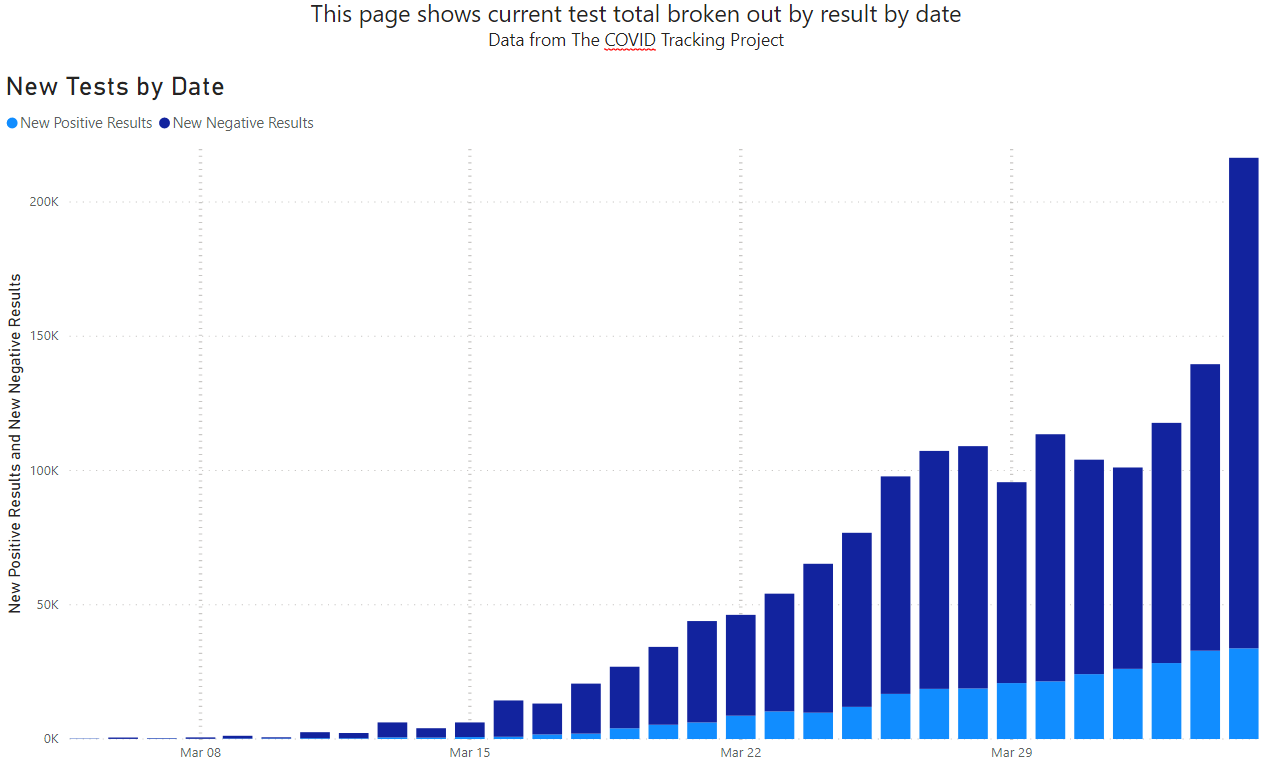
More new tests in the US today than new cases, by ratio.
Important News Items
There is truckload of important, new news. We are not able to cover it all today, we plan on surveying what we think are the most important developments in the days ahead.
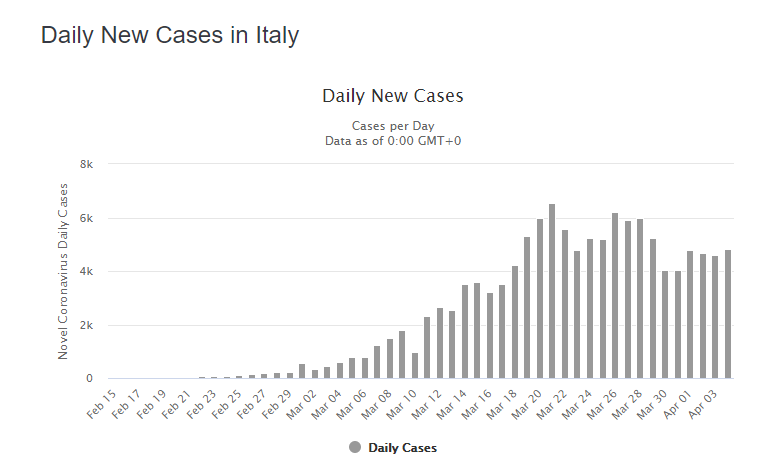
International Numbers
Italy remains stable. Of course, we’d love to see that number decreasing, not staying the same.
Other
Thanks to those that have shared kind words or liked these posts. We’re doing out best to put out data-driven analysis, each one of these takes about 2 hours. It’s helpful to know that they are being read.
If you want copies of the Excel sheet and PowerBI Reports we use to put these together email us, info@jmaddington.com. Right now, our PowerBI combines data from JHU, NYT, COVID Tracking Project, IMHE and the TN Department of Health. Most sets are updated daily.

Download our Report!
Get your copy of What Every Business Owner Must Know About Hiring an Honest, Competent, Responsive, and Fairly-Priced Computer Consultant.