We have very little in the way of actual news today, so we will dispense with what we do have as fast as we can.
Big picture: new cases are down in the US as a whole, and in Tennessee. Knox County showed a notable jump with 14 new cases. We’re hesitant to interpret that number on its own: we’ll see what the county health department says at tomorrow’s briefing. The first look we’ve had at a phased US re-open basically looks like the shutdown in reverse: the last things to close will be the first to open, etc. Social distancing remains. We have a couple of thoughts on that at the end.
Numbers
We have changed our chart format at the US and state levels to better reflect the most useful numbers. Only new cases are below (columns) with a 7-day rolling average (line). While we won’t totally give up on total cases it is less interesting because it can only go up. New cases tell us more about where this thing is going than total cases.
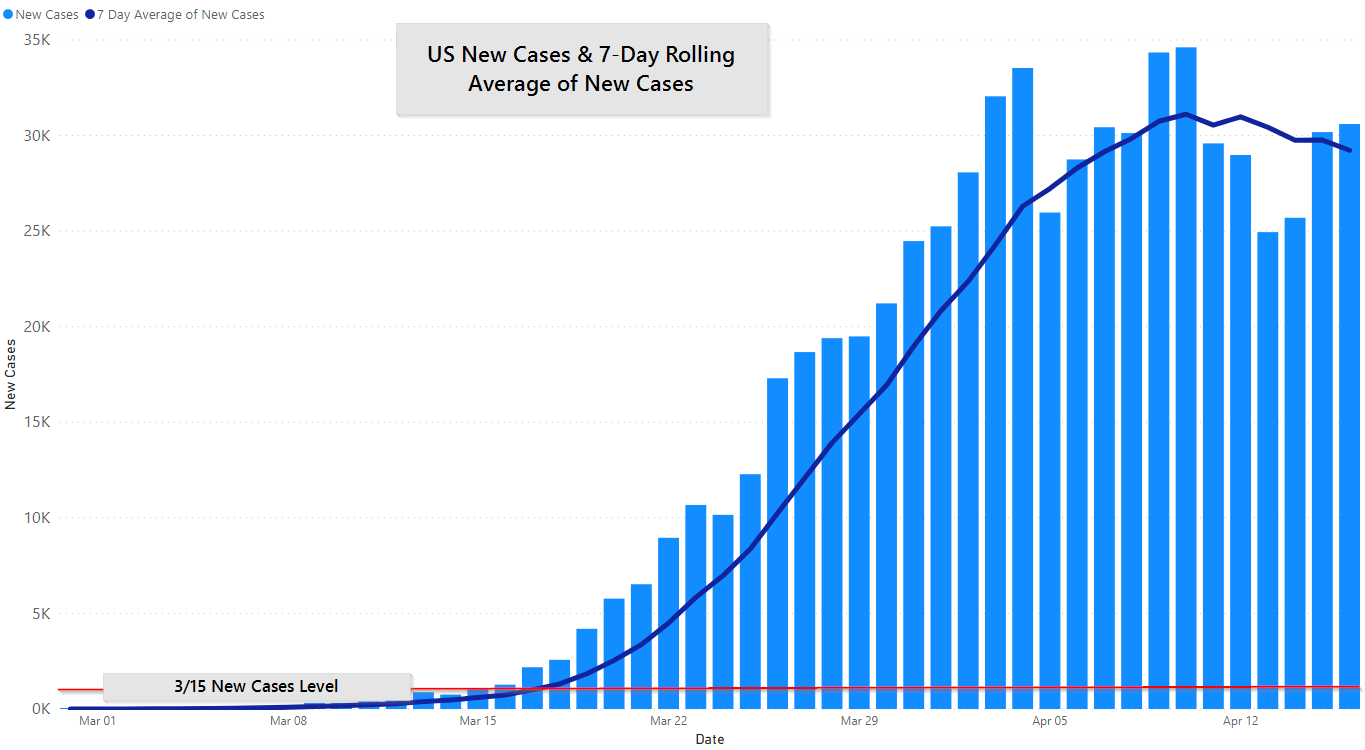
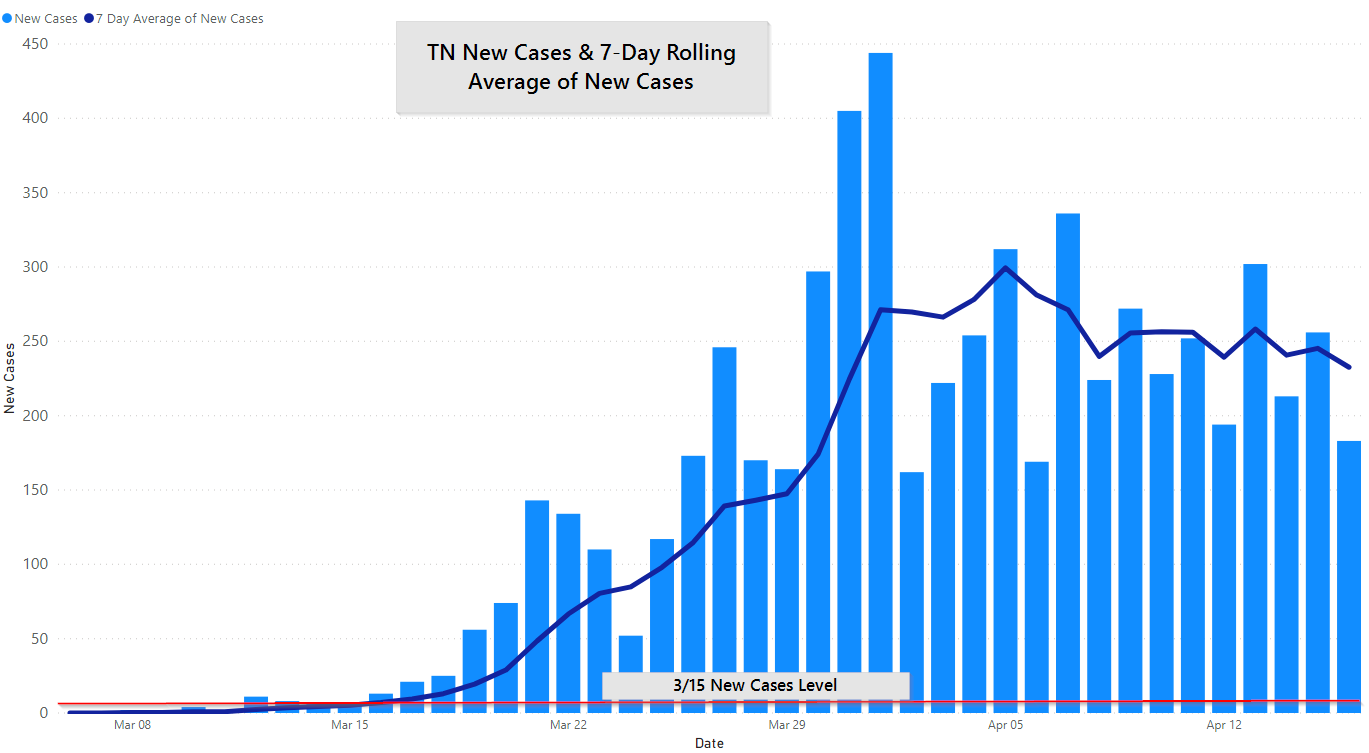
On the whole, new cases are clearly trending downward. Zooming into TN you see what we’ve mentioned before, things are mostly flat. This is mixed news. On the one hand, it’s great that new cases are not growing, and, of course, our absolute number of cases is less than than the new cases for the state of New York on any given day this in April.
At the same time, it would be much better to see that line taking a steeper slope downward.
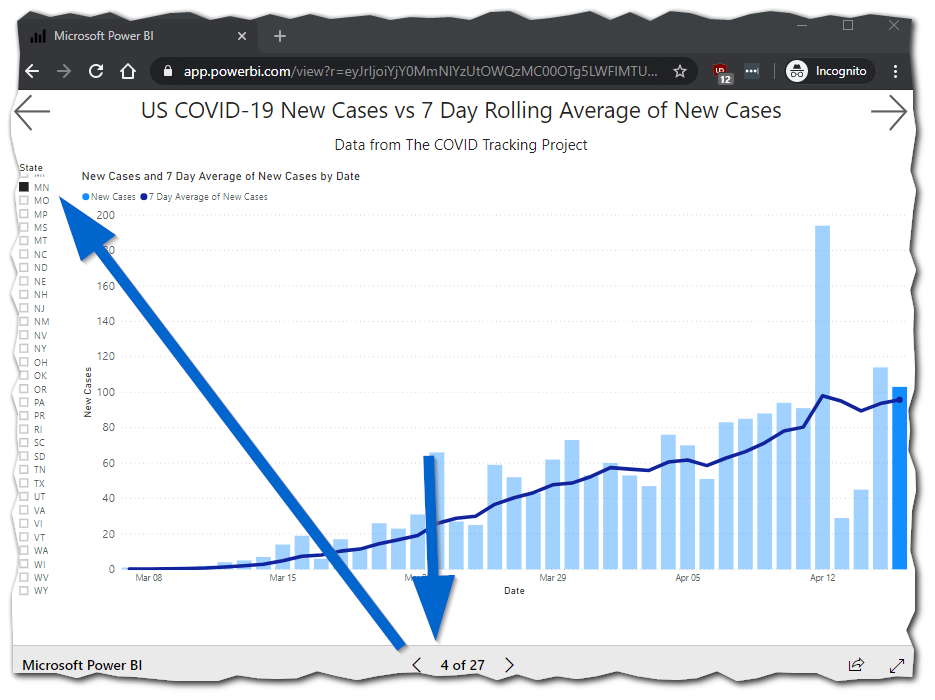
By the way, if you want to see the same graph for your state click here, go to the fourth page and select your state on the left.
Here is MN.
Also, you can do it on your phone but it is much easier to navigate on a bigger screen.
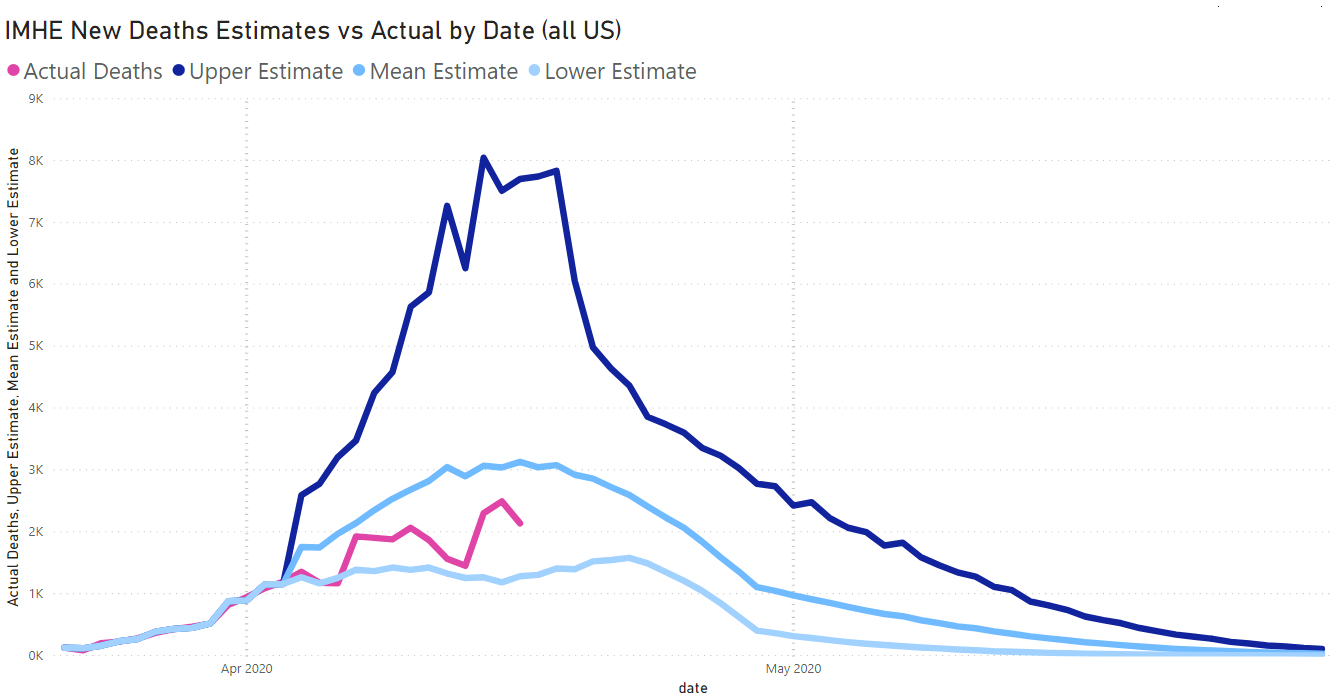
Pretty much no one is willing to say that we are past the apex, as a whole because, (1) they don’t want people to let their guard down, and (2) it takes 10-15 days of data, on the low end, to make that call responsibly.
We don’t want to be irresponsible, but we’ll note that —broadly — the IMHE model (03/27 version) seems to have held up rather well. This model predicted a national mid-April peak.
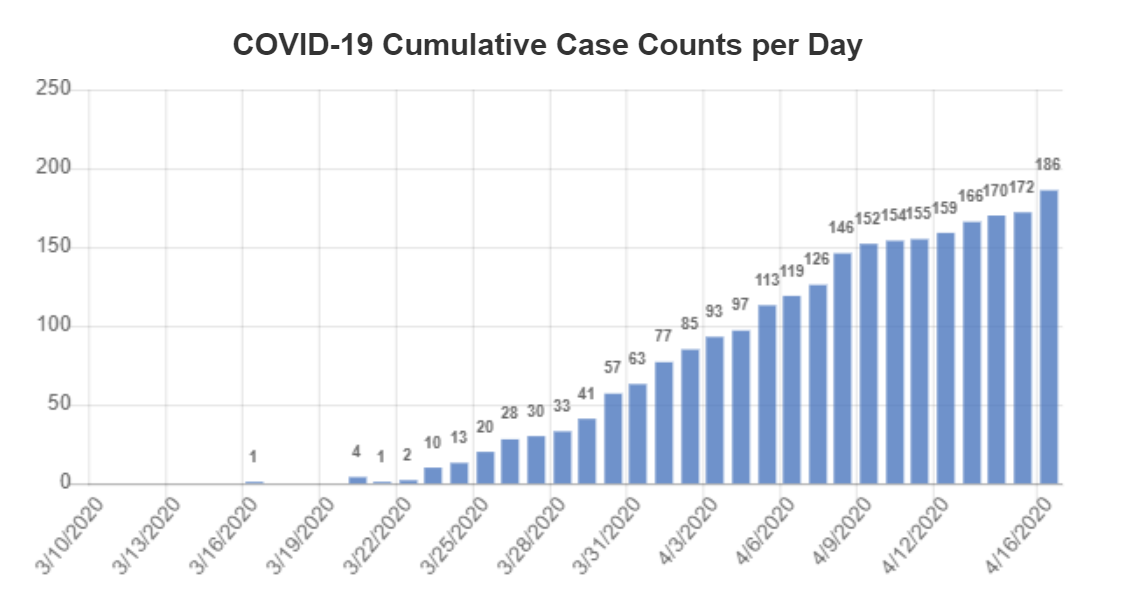
The Knoxville area continues to see a slow growth in cases:
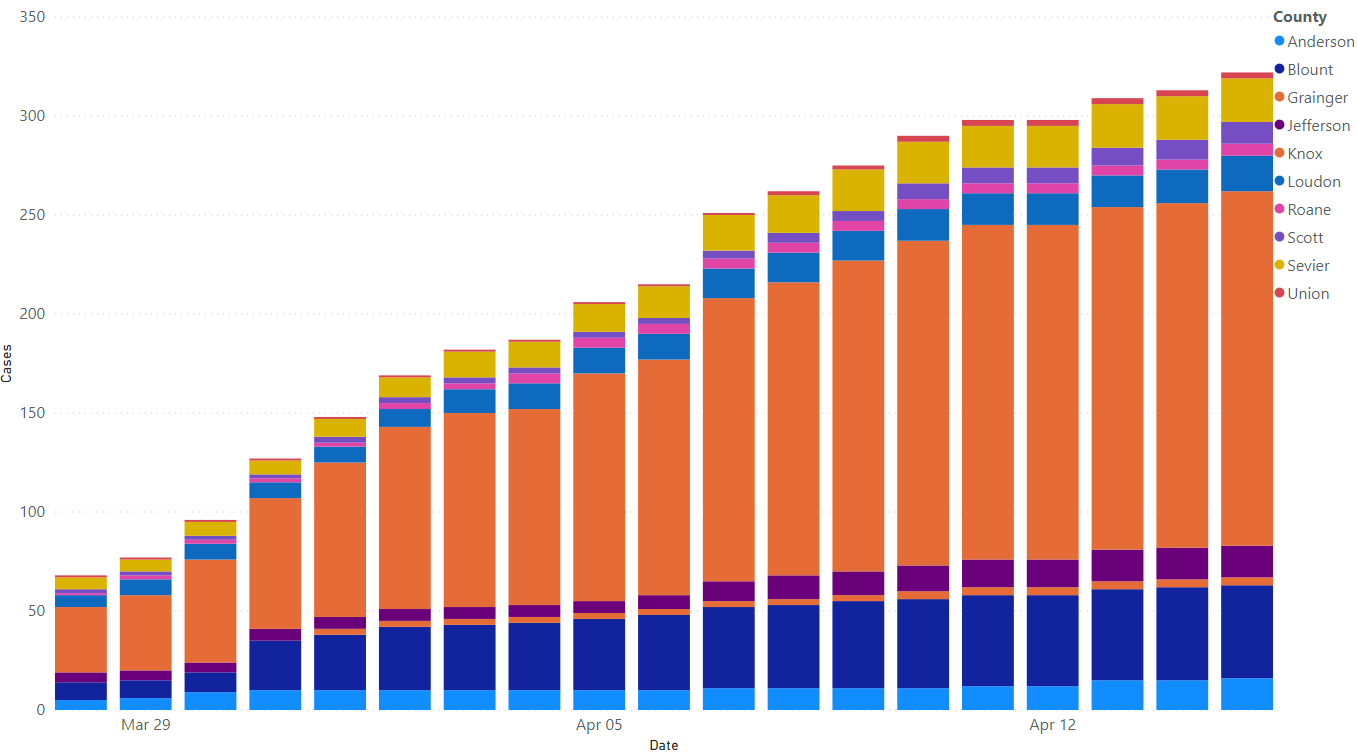
Knox County is still the bulk of the area cases, and today it jumped. There was no briefing today so we haven’t heard if KCHD thinks anything of it. It is equally possible that we had a notable increase or that Knoxvillians took seriously the call to go and get tested.
News
The SBA Paycheck Protection Program ran out of funds, as expected.
The Washington Post ran a story today about how COVID-19 has become the second leading cause of death for Americans, a point we made when it was in third place, on April 2.
Multiple outlets are reporting about a nursing home in New Jersey that was so overwhelmed with deceased it was putting bodies in an outdoor shed. It isn’t surprising, these same types of care facilities were overrun with deaths in Italy and Spain. In Tennessee, 71+ make up nearly 60% of COVID-19 deaths (TDH, as of today).
The US has officially lost more jobs in the last month than were gained in the last 10 years. To us, this is viewed, equally, from two perspectives. One, the downside economics of COVID-19 are awful. Two, awful is relative, we have as many jobs in 2020 as we did in 2010. This level of jobs was once called, “normal.” That isn’t to minimize the pain, especially if you lost your job. We can and will come back, the question is: when?
Initial Thoughts on Opening Up
We’re going to focus on Tennessee here but the broader application works anywhere.
Vanderbilt released their own predictive model, especially for Tennessee, on April 10th with an update today. One of its findings was that in mid-March each infected Tennessean would go on to infect another five people (the transmission number). [1] Another takeaway was that they estimated that it only took ten positive cases in Tennessee to launch the epidemic here. (Scroll back up and see what the new cases line looks like for TN from March 15 to April 1).
By last week that number had dropped to 1.4, and by this week, “about one.” A transmission number of 1 means that cases are neither increasing nor declining. The transmission number has to go below one for us to actually make progress against COVID-19, not just battle it to a draw.
The descriptive analyses above highlight an essential takeaway: Tennessee’s recent progress, while real and positive, is fragile. Our analysis of the recent data indicatesthat without further changes to the transmission number, Tennessee may be settling into a “simmer.”
Vanderbilt COVID-19 Modeling Report for Tennessee April 16, 2020
It seems possible to have a phased re-opening, as is being suggested, without a massive increase in cases, but everything has to go right. We can’t imagine that it will. Instead, we believe it is likely that things are going to go up and down for a while. The transmission number will stay steady or decrease, and then jump in certain geographies as we open up too fast. Those areas will end up going in a stricter lockdown, either mandated or voluntarily.
We mostly think that the math determines this: if the transmission number goes back up to 2.5 or 5.0 then you are looking at a two-to-fourfold increase of cases inside a week, and a four-to-sixteenfold increase inside of two or three weeks. That’s where we were at mid-March as things began to shutdown. That was only a month ago.
It’s also just the way people work. Our models are static and only show lines doing one thing. People react to a changing environment. We’re quite sure that no one wants to go back into a state-wide mandated lockdown so it is likely that voluntary compliance with social distancing will be higher in May than it was in March. In the US we had 40 cases March 1st, and 4,902 by March 15th. [2] We don’t expect to see jumps that high, but in large part, because people believe that it will happen now.
You could sum up our thoughts as this: we are equally confident that we’ll come out of lockdown and that we’ll mess it up in the process. And we’ll get through it.
Get In Touch
Need help thinking this through? Access to more data? Help getting your technology in order to handle what’s here and what’s coming? Contact us today.
Other
Thanks to those that have shared kind words or liked these posts. We’re doing out best to put out data-driven analysis, each one of these takes about 2 hours. It’s helpful to know that they are being read.
If you want copies of the Excel sheet and PowerBI Reports we use to put these together email us, info@jmaddington.com. Right now, our PowerBI combines data from JHU, NYT, COVID Tracking Project, IMHE and the TN Department of Health. Most sets are updated daily.
[1] Dr. Pearcy of TDH today said that number was closer to 2.5 or 2.6. [2] TN had 52 cases on March 16th and 2,683 on April 1st for a comparison.
Download our Report!
Get your copy of What Every Business Owner Must Know About Hiring an Honest, Competent, Responsive, and Fairly-Priced Computer Consultant.