Today we will hit the numbers, briefly, they look the same as yesterday. We’re going to go over a couple of brief news items and then dive into Tennessee opening up – -again. On this final topic we’ll jump into the specific gating criteria that the White House has issued and Governor Lee’s take on where we are on it.
Numbers
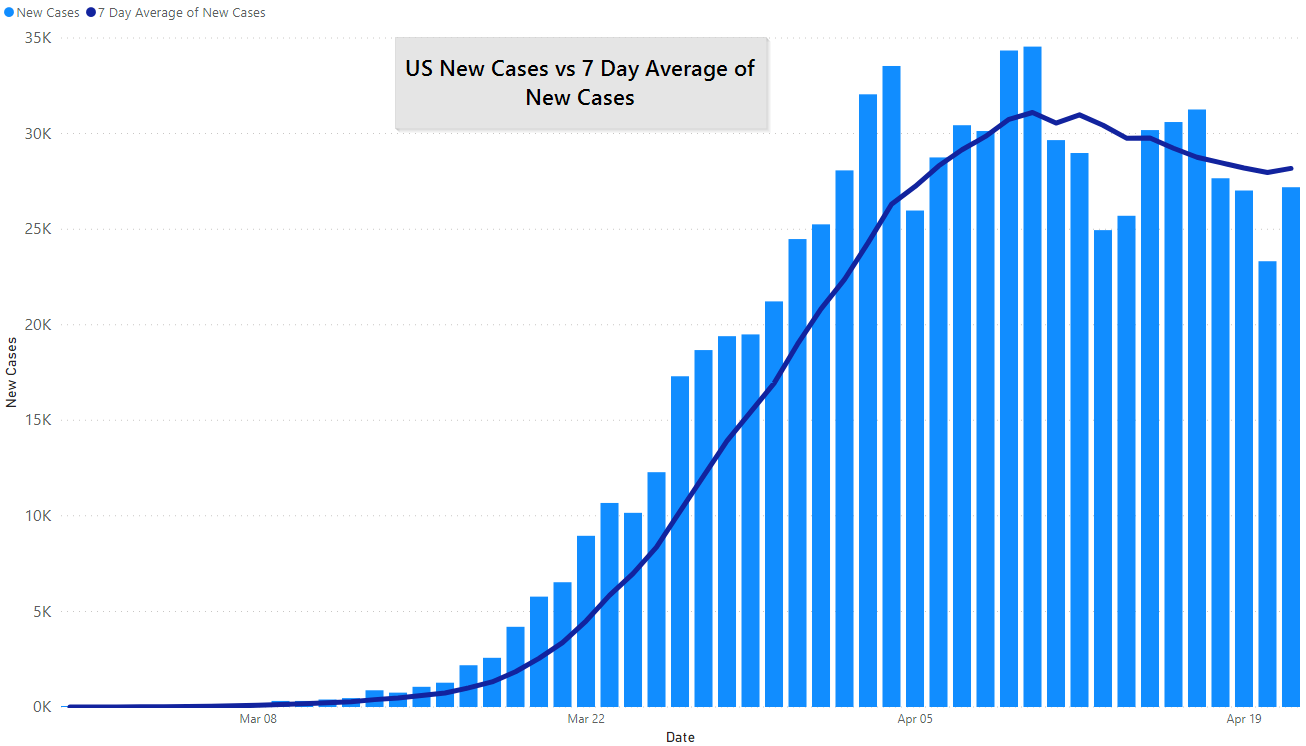
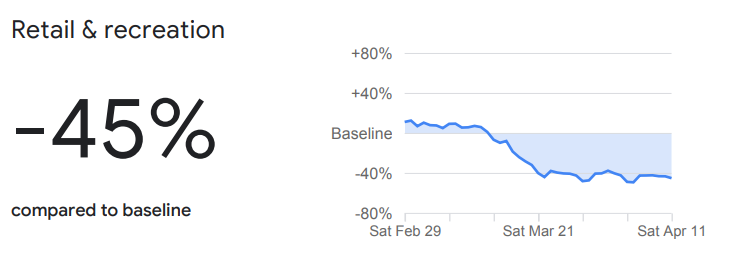
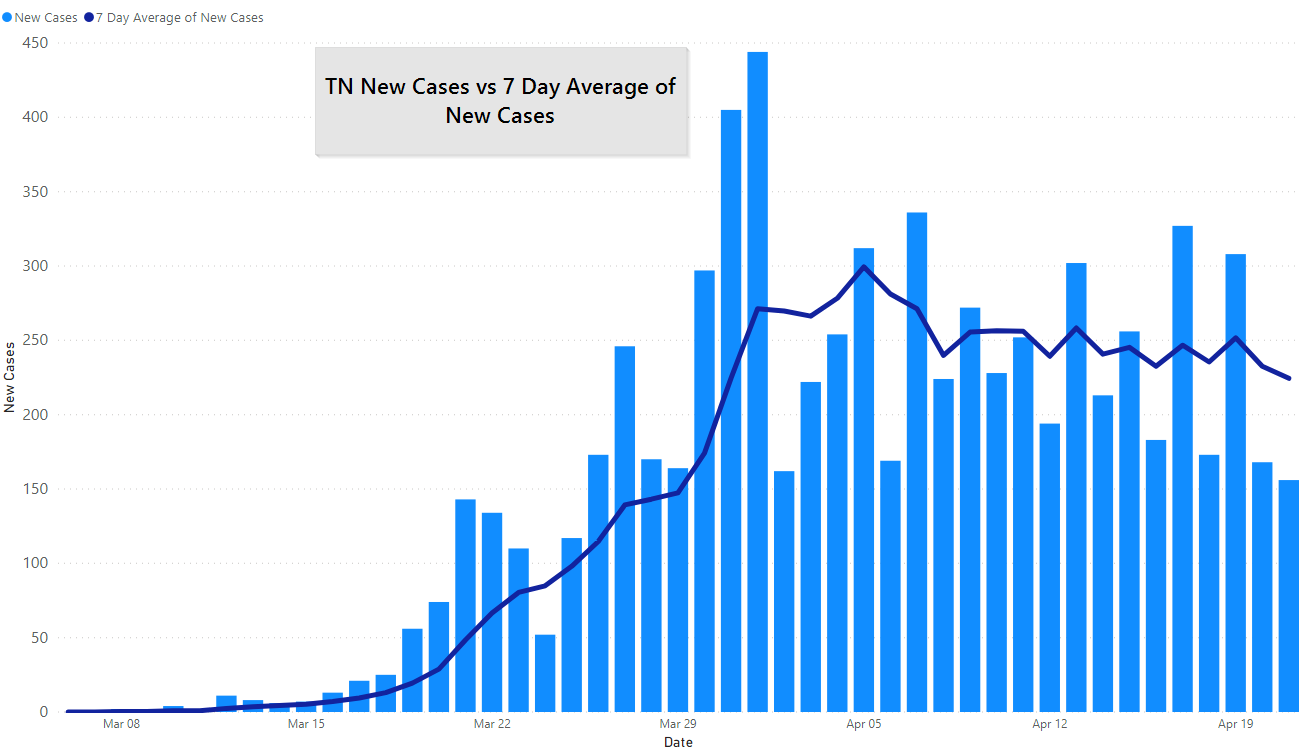
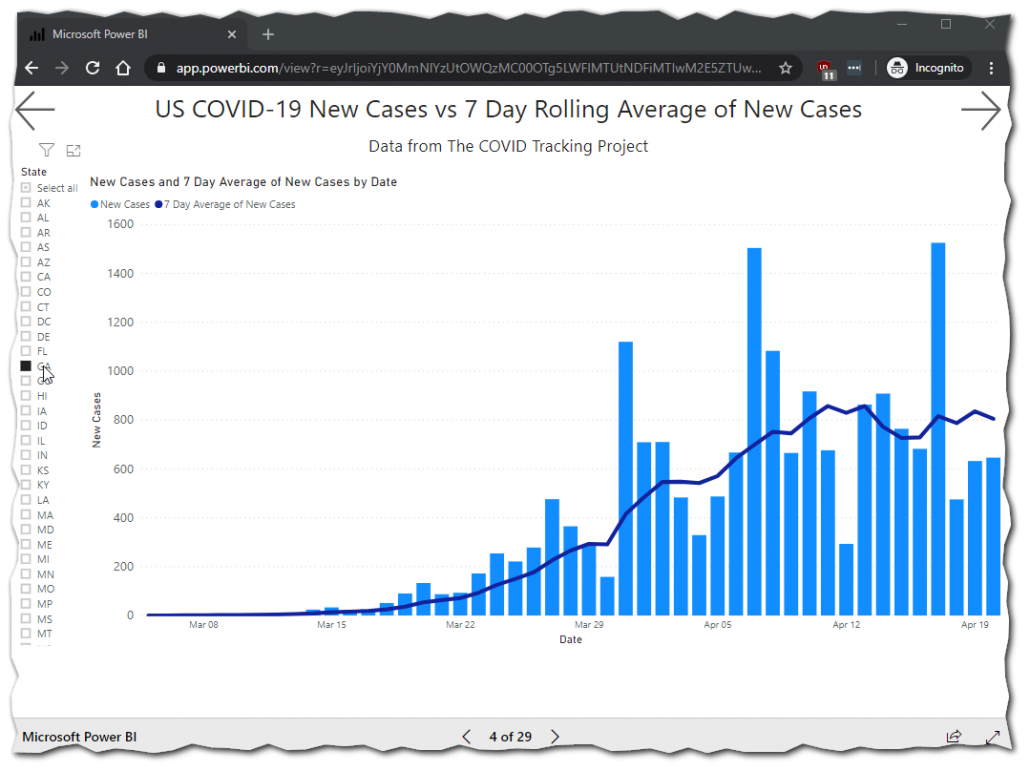
The US as a whole is just flat. In one big what this isn’t a surprise: mobility data from Google and Unacast both show the US plating on social distancing in late March. If confirmed cases lag exposure time by two to three weeks then our confirmed cases roughly match the change in our behavior.
Click on any image to see it larger.
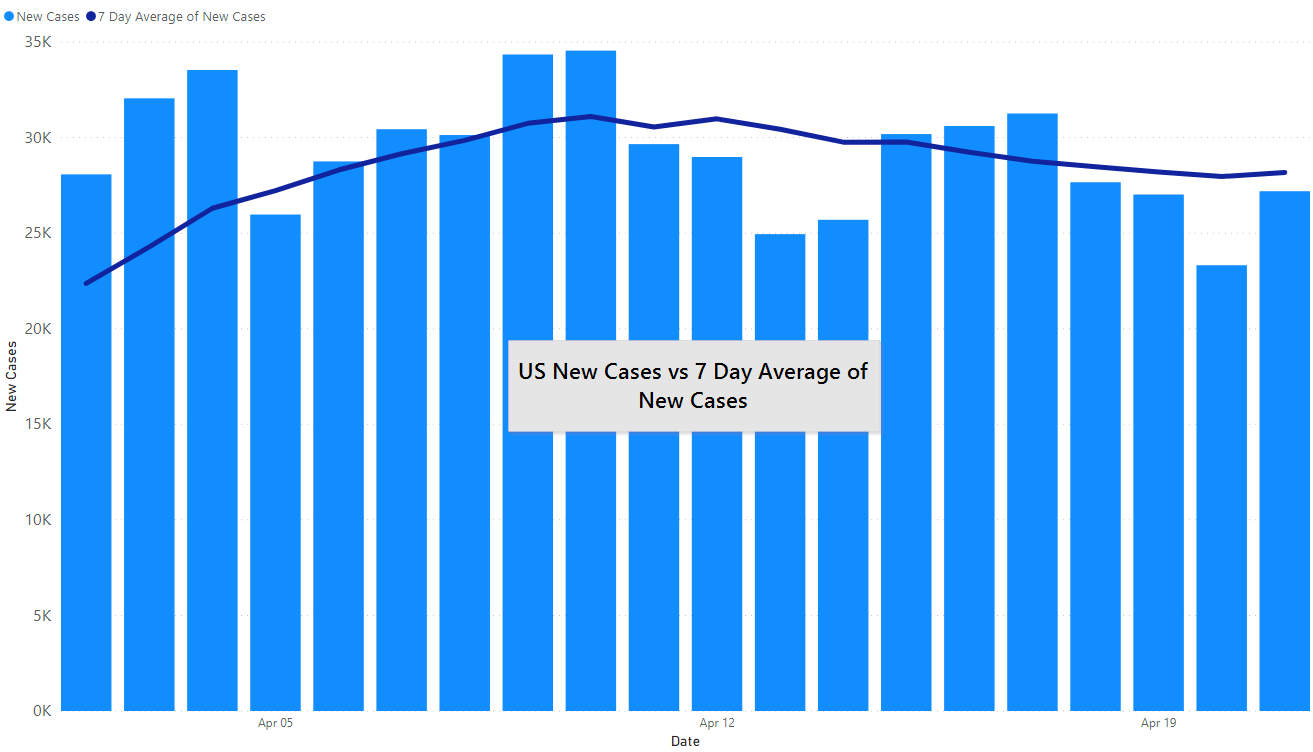
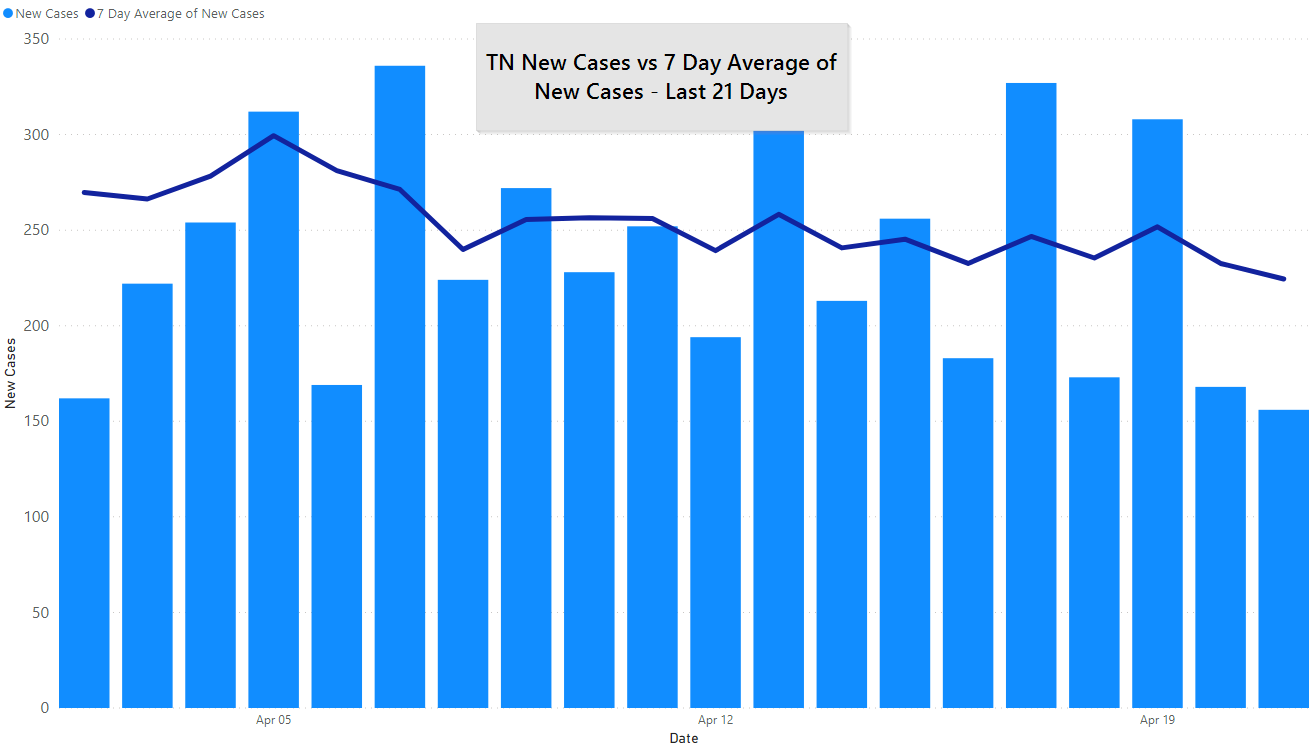
Here is the same chart set to the last 21 days. The peak is still visible but the falloff looks very horizontal.
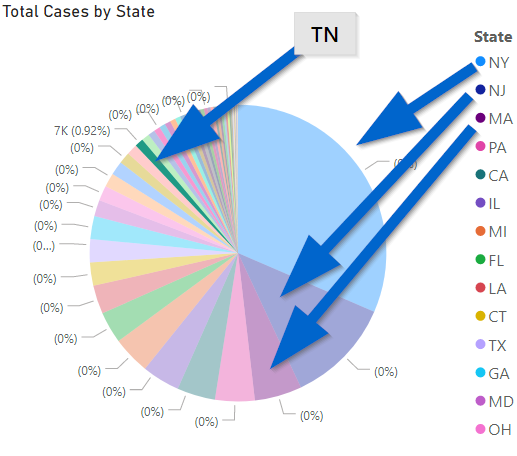
Tennessee isn’t that much different, just on a much smaller scale. We’ve been saying for weeks that the situation in New York, New Jersey, etc., is not the same as the US as a whole and the data continues to bear that out. Four states make up over half of the total US Cases of COVID-19 to date. NY & NJ make up about half of the total deaths.
Notably, it seems that most of the arguments on social media completely ignore the data and make arguments based on New York, or the entire US and apply it to a specific geography. In many ways, it makes sense to consider each state as its own country when trying to make comparisons.
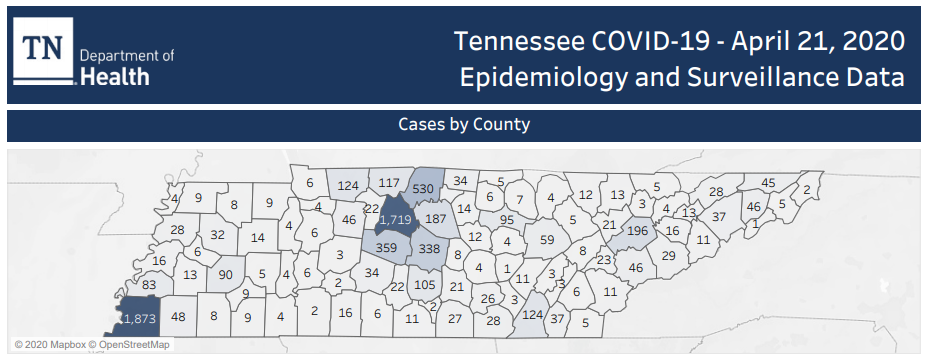
Tennessee, too, had massive differences in caseload from one region of the state to another. The entire area around Nashville is affected, while the outlying counties of Shelby County remain relatively low — compared to Shelby.
By the way, if you want to see the same graphs for your state click here, we pull nearly all of our own visuals from this report. Typically updated at the same time the evening’s post goes up.
Here are GA new cases.
Also, you can do it on your phone but it is much easier to navigate on a bigger screen.
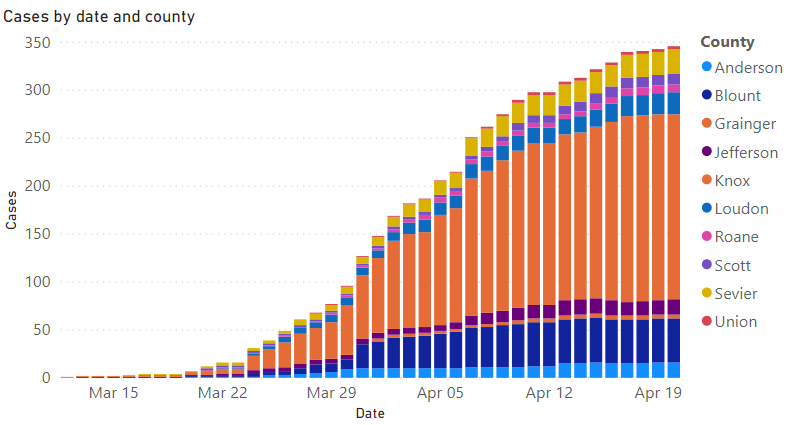
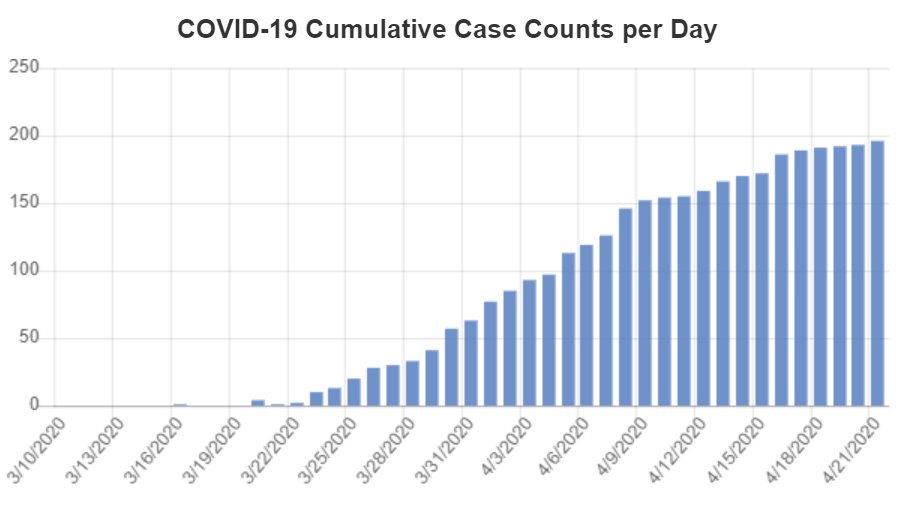
The Knoxville area continues to see a slow growth in cases:
Knox County specifically, looks the same. We’ll give you the Health Department’s ZIP-code based map with some major caveats:
- This could reflect access to testing more than actual cases counts
- ZIP codes are made for mail delivery, not geography
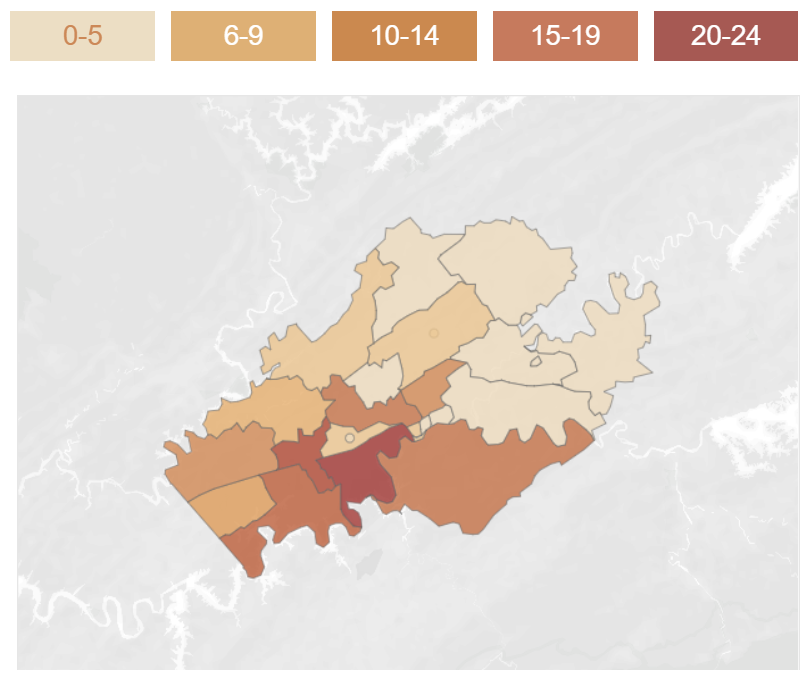
We’d be surprised if the Knox County cases did not jump by late this week of early next. KCHD added 800 tests to the total in the last two days but has a lag of at least four to five days to get results. If the positivity rate continues to be above 5% that’s at least 40 “new” cases from two days of testing. That will look pretty big on a bar chart, it doesn’t mean anything changed except our perception of reality.
Also, all 800 of those people are supposed to be self-isolating. If you’re sick enough to get tested you’re sick enough to be at home.
Knox County News
Dr. Buchanan does a great job at these press briefings. She is always calm and steady. Today, she announced that Knox County will new renew the stay-at-home order but instead follow the plans that the state lays out.
“Re-opening is not a return to pre-pandemic levels of activity.”
Dr. Buchanan, KCHD
Testing demand was high enough at the drive-through location that KCHD has made testing by appointment only (call 865-215-5555). KCHD ran out of testing supplies, at the state briefing Dr. Piercey confirmed that more supplies would be delivered by Thursday.
Could churches resume normal services this weekend? “Not at this time.”
“[Flattening the curve is] not about no new cases.”
Dr. Buchanan, KCHD
“Closing things down was not a long term solution.”
Dr. Buchanan, KCHD
Dr. Buchanan went out of her way nearly every other answer to emphasize that social distancing must continue and that this is an everybody effort not a governmental effort.
Subscribe on YouTube here if you want to see the briefings live.
“A lot of this rests on the community… everybody has to do their part.”
Dr. Buchanan, KCHD
National/International News
Hong Kong, the population of TN inside the footprint of Nashville, went from zero new cases yesterday to four today and responded by extending their social-distancing rules. Also, their restaurants are still open.
“This is not the time to be complacent,” Lam warned. “If we relax, the good work that we have done will be in vain. That’s why the bans, that would have expired on April 23, will now be extended by two weeks.”
The South China Morning Post
Singapore is in a similar boat, with 5.7m people they’ve extended a partial shutdown through June 1. With over 9,000 cases they have many more than Hong Kong, but four in five of them are in dormitories for migrant workers.
“To our migrant workers, let me emphasise again: we will care for you, just like we care for Singaporeans.”
Singapore’s Prime Minister Lee Hsien Loong
The US Senate has reached a deal with the White House to deliver $500bn more in “interim” COVID-19 aid (The House has not voted on it). You can click on the link for details. If you have not applied for the EIDL and PPP find a bank today to work with and get your financials ready today. We’ve done both, been approved for the PPP and would be glad to offer assistance.
Today we received both our “forgiven” EIDL advance ($6,000) and our PPP funds (about 10 weeks worth of payroll). I want to thank Chester at First Horizon Bank and all of the staff at Mitch Reed & Associates for their combined help. This is the only time in my life I’ve gotten non-automated emails from banks at midnight, or 6:00 AM on a Sunday.
We got our financials ready early, before there was a PPP. We probably wrote about it a month or so ago. It was worth it.
Tennessee Opens Up, in a Week
Today’s briefing state-level was something else, with more educated questions from reporters than I have heard yet.
Governor Lee promised more guidance on what businesses could open up on Monday before the end of the week. He went out of his way to emphasize that social distancing, working from home, cloth masks and hand washing all need to continue.
He said that the state is providing $10m in relief for rural hospitals and that at least $7m is expected from the federal government.
The rest of this post is going to get heavy into numbers, definitions and the White House’s gateway criteria. If you like all of that read on. If not, Tennessee only kind of meets all the criteria and that is probably OK.
“While we want to have everything open as soon as possible we will continue to discourage social gatherings of ten or more and will continue to restrict visitors at nursing homes and hospitals until further notice.”
Governor Lee
Gateway Criteria and Tennessee
Yesterday we quoted a Harvard paper that we believe that White House guidance was based on, today we’ll actually look at the official White House guidance on opening up.
SYMPTOMS [Criterion 1]
Downward trajectory of influenza-like illnesses (ILI) reported within a 14-day period
AND
Downward trajectory of covid-like syndromic cases reported within a 14-day period
White House Proposed State or Regional Gating Criteria
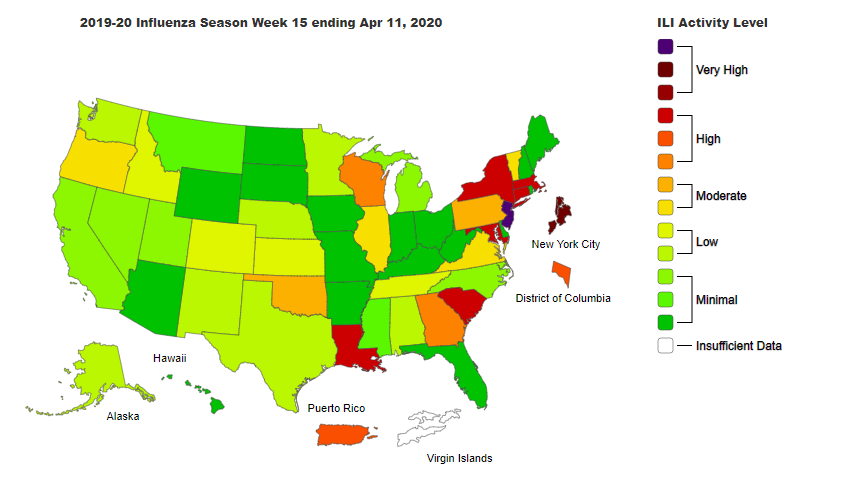
The White House here is referring to symptomatic surveillance. This is, in short, getting doctors’ offices and other care providers to report on cases where a patient shows a certain set of symptoms. We do this with the flu already [ILINet]: we’re not going to get everyone tested, but by getting providers to report “flu-like” symptoms we can gain a macro-level view of how it’s spreading.
Helpfully, the CDC already has data and maps available to see flu-like cases around the country, here is last week. Tennessee has moved from “High” at the beginning of the month to “Low” last week.
So, Tennessee is a go on the flu-like symptoms.
COVID-19 symptoms? We have no idea. If that’s being tracked in the same way we haven’t found it yet. The CDC page for COVID-19 surveillance actually shows the same map as the flu page.
Also: keep in mind that “surveillance” is being used in a technical sense here. There is probably a PR reason that the White House avoided using it.
HOSPITALS [Criterion 3]
Treat all patients without crisis care
AND
Robust testing program in place for at-risk healthcare workers, including emerging antibody testing
White House Proposed State or Regional Gating Criteria
We’re going to define “Crisis care” to begin:
“Crisis standards of care” is defined as a substantial change in usual healthcare operations and the level of care it is possible to deliver, which is made necessary by a pervasive (e.g., pandemic influenza) or catastrophic (e.g., earthquake, hurricane) disaster.
National Academy of Sciences (2010)
We can’t speak for the whole state, as far as we know Tennessee is meeting this criterion. However, probably only a handful of people in the state could speak authoritatively on it, as each hospital would have its own standards for operating in this mode or not.
“Robust” [PCR] testing: We clearly have enough tests and capacity in Tennessee to meet this criterion. The only catch is that Dr. Piercey said that labs are taking 2-3 days to get back to patients, which is 1-2 days too long. Assuming that they are prioritizing healthcare workers so results can be delivered in 24 hours we’d be in good shape here.
“Emerging antibody testing,” I don’t think this means anything, today. Serological testing is the term and only a single test claims to have a specificity high enough to make it valuable. As Dr. Scott Gottleib put it to CNBC, with a 5% (real) infection rate a test with a 95% specificity rate would return more false positives than true negatives. There are no published peer-reviewed studies on COVID-19 serological testing right now.
The one study that has been done and claims a proper specificity was widely panned by epidemiologists on Twitter.
It’s probably too early to have an informed opinion on serological testing other than to say we don’t know that we know a good test exists anywhere in the world.
That means Tennessee is a go on the third criterion, let’s return to the second.
CASES [#2 Criterion]
Downward trajectory of documented cases within a 14-day period
or
Downward trajectory of positive tests as a percent of total tests within a 14-day period (flat or increasing volume of tests)
White House Proposed State or Regional Gating Criteria
So, there are two ways you can interpret that first statement, ACTIVE cases (Total cases ever, subtract people who recovered or died) or New Confirmed Cases. From other published literature we believe that this second interpretation is correct.
We’ll go ahead and look at both numbers.
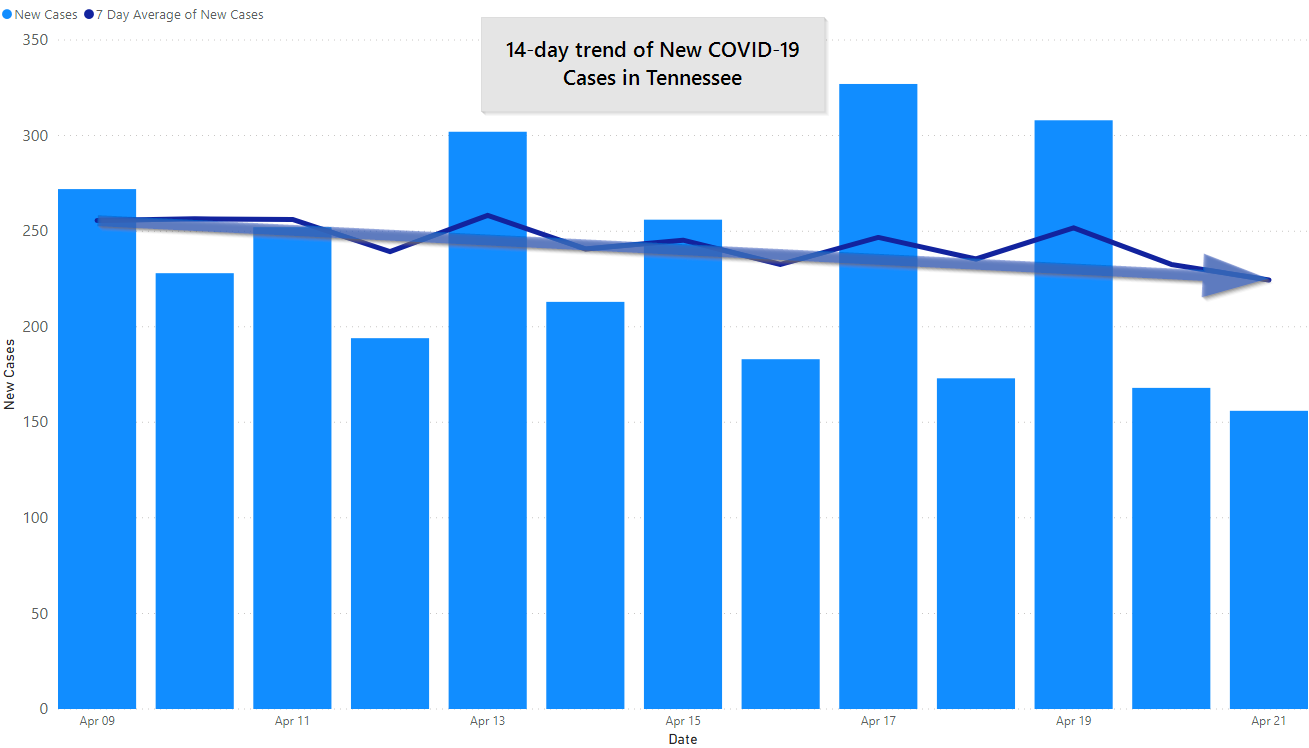
“Downward trajectory of documented cases within a 14-day period”: Tennessee technically meets this, if you look at just the start and end date. We had 256 7-day average of new cases on April 9th and 224 7-day average of new cases today. Saturday, April 19th we were still at 252 for the average, and April 13th we were at 258.
So, on this one, it may depend more on your definition of “trajectory” than anything else.
We’re going to address a data quibble here. Dr. Piercey and Governor Lee do themselves no favors when they continue to mention 18 sustained days of single percentage increases in new cases. First, it confuses everyone because only Tennessee alludes to this as some sort of criterion, it certainly isn’t in the official guidance.
Secondly, a percentage where you add roughly the same amount to the numerator and denominator every iteration will naturally decline. If we add 250 cases each day and measure our “day on day percentage increases” we’d have 50% on day 1, 33% on day 3, 25% on day 4 and so on.
That quibble aside, both Lee and Piercey clearly have a handle on the other numbers which are more meaningful. We’ll continue.
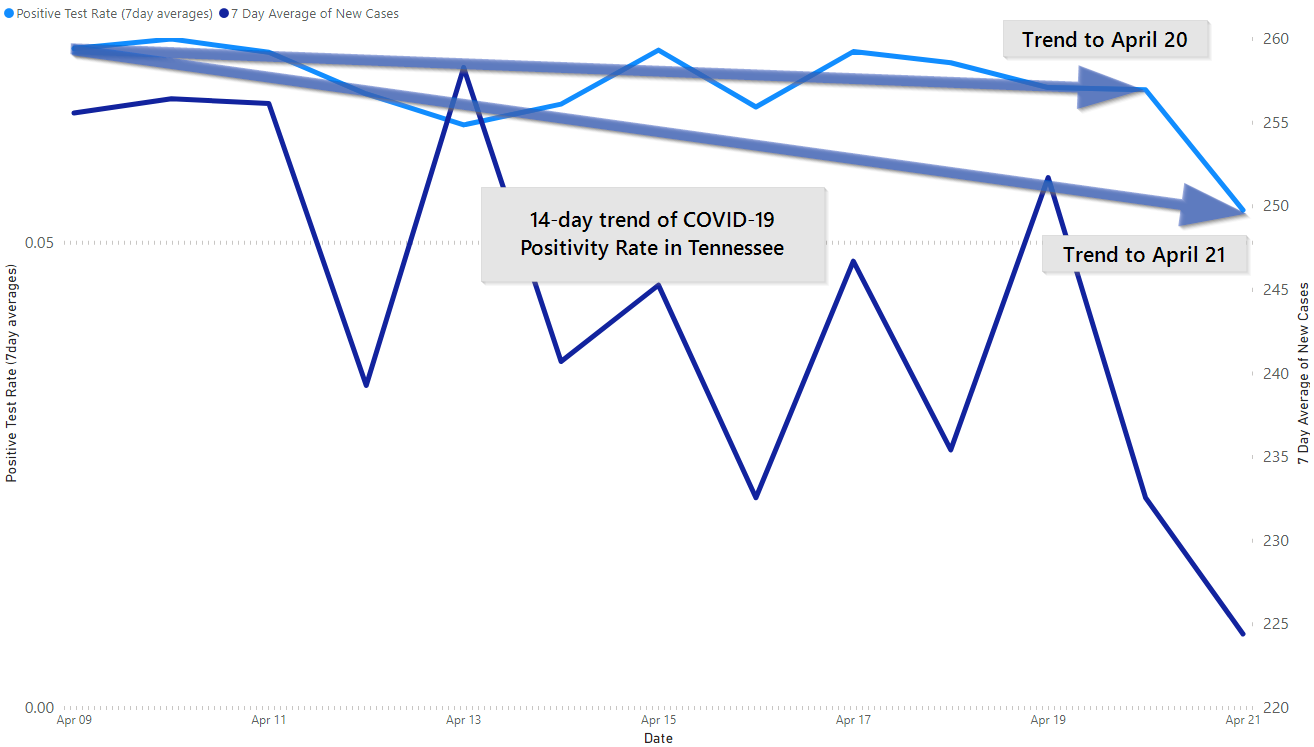
“Downward trajectory of positive tests as a percent of total tests within a 14-day period”, this is positive tests divided by total tests, called the positivity rate.
The positivity rates is an indicator of (1) if you are doing enough testing, and (2) how many more cases you may find if you test more. [Edit: For context, the US is over 20%, South Korea is 2%, Germany 7% and Tennessee about 6%. That puts us at well below the national rate but above where we would be in a perfect world. Georgia is over 20% as well.]
Like new cases, this is technically a pass, or it depends on what “trajectory” means, if you just look at April 9th (14 days ago) and today. If you look at April 15th and 17th things are flat overall, and yesterday we were still basically the same.
In both cases, the data today say that our trajectory is more horizontal than downwards vertical.
Our Current Interpretation of the White House Criteria and Tennessee
It’s clear that both Dr. Piercey and Governor Lee have a handle on the numbers as a whole. Even the Governor was able to answer a question off the cuff yesterday on Tennessee’s COVID-19 numbers.
“Social distancing… is way more important than the numbers on a chart.”
Dr. Piercey
Second, the criteria are intentionally very broad and open to local interpretation. Let’s look at NY & TN on the same graph for once.
State and local officials may need to tailor the application of these criteria to local circumstances (e.g., metropolitan areas that have suffered severe COVID outbreaks, rural and suburban areas where outbreaks have not occurred or have been mild).
White House Proposed State or Regional Gating Criteria
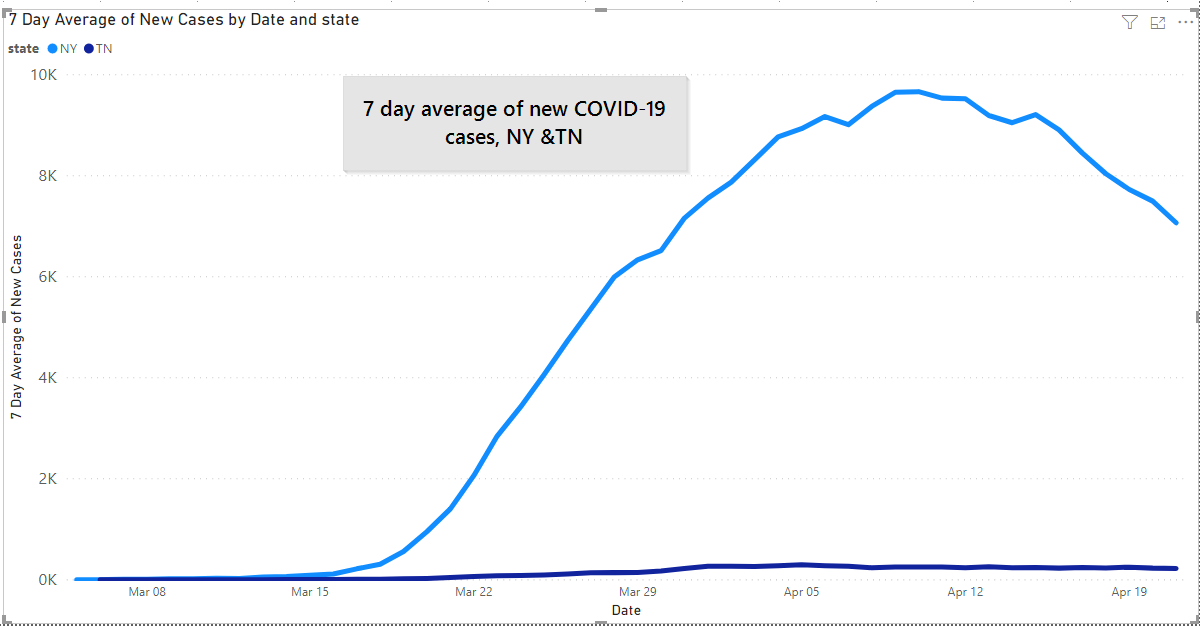
You have to zoom in to even see that the dark blue line that is Tennessee is not the X-axis. The point is that the application of the criteria will and should vary.
Finally, and both of these points cannot be repeated enough: the end of the lockdown doesn’t mean an end to social distancing the lockdown was never about stopping COVID-19, it was and is about not overwhelming our healthcare system.
This is a higher bar. As Vanderbilt has said, our current state is “fragile,” and it won’t take much to return to a pandemic level. Tennesseans also aren’t social distancing more today than we were two weeks ago, it’s not clear that the lockdown continues to be effective to this end. Likewise, whatever progress we have made and will make come from social distancing measures and fantastic hygiene not a mandated lockdown.
A vaccine is still 18-24 months out, that is the optimistic view. The pessimistic view? It’s never. We don’t have vaccines for any other Coronaviruses.
We will be living with COVID-19 for a long time. We will always be balancing. The day when we have the balance perfect will never arrive. We believe that this is a rational next step for Tennessee at this time.
(Georgia? That’s a much harder case to make).
Get In Touch
Need help thinking this through? Access to more data? Help getting your technology in order to handle what’s here and what’s coming? Contact us today.
[wpforms id=”4995″]Other
Thanks to those that have shared kind words or liked these posts. We’re doing out best to put out data-driven analysis, each one of these takes about 2 hours. It’s helpful to know that they are being read.
If you want copies of the Excel sheet and PowerBI Reports we use to put these together email us, info@jmaddington.com. Right now, our PowerBI combines data from JHU, NYT, COVID Tracking Project, IMHE and the TN Department of Health. Most sets are updated daily.

Download our Report!
Get your copy of What Every Business Owner Must Know About Hiring an Honest, Competent, Responsive, and Fairly-Priced Computer Consultant.