Today is an abbreviated update. We’re working on putting together an interactive report so you can jump into this data on your own.
If you want to preview this interactive report and give us feedback please email Jonathan.addington@jmaddington.com
Where are we on the curve?
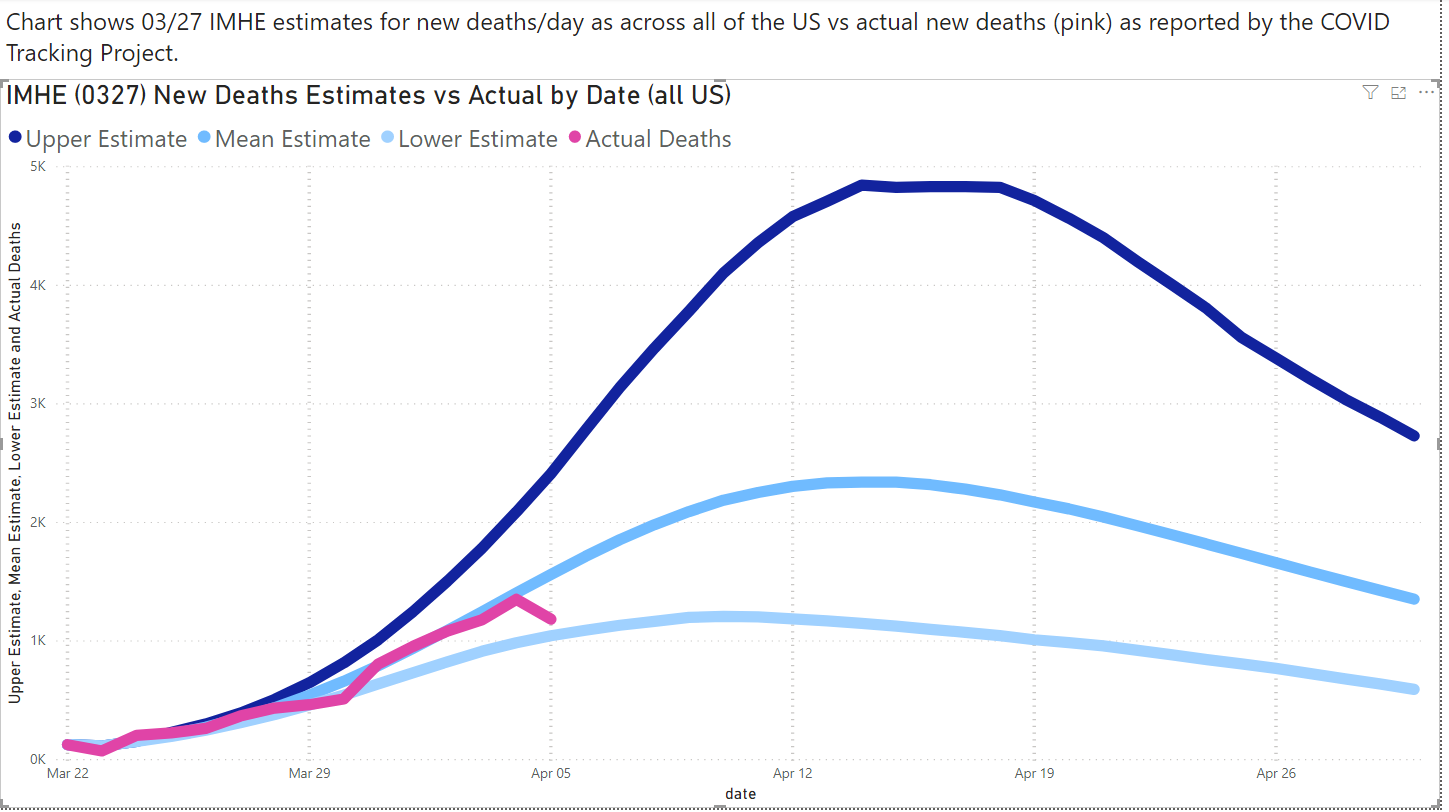
About 9 days to peak (US whole) and new deaths per day coming in under the average estimate from IHME’s 03/27 projections. That is a good thing.
In fact, we’re getting closer to the lower estimate compared to the original projection.
This graph uses the 03/27 IMHE projections.
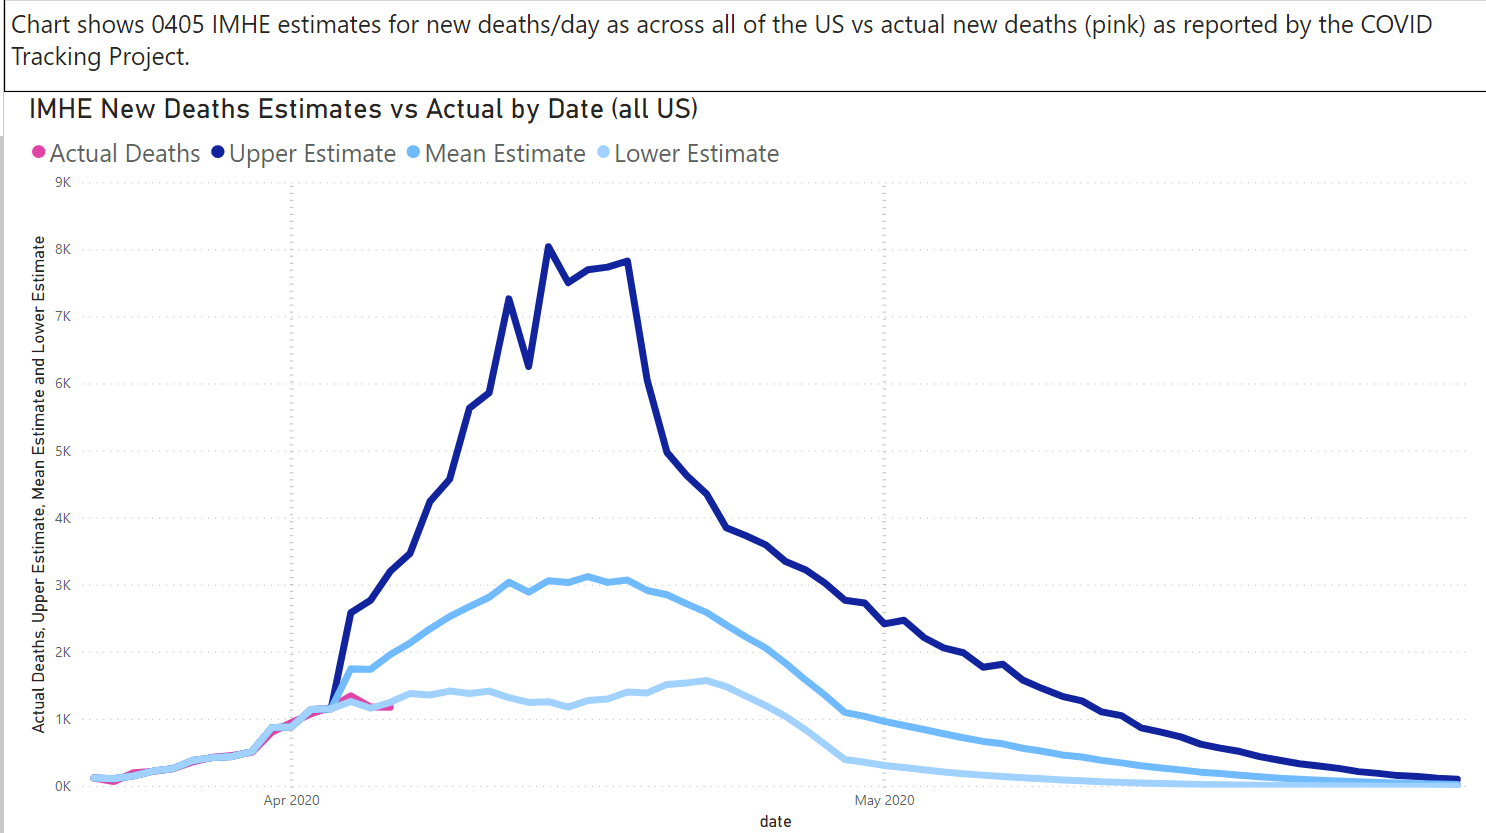
The newest projections from yesterday show that we are dipping even further under. (Of course, deaths are the same.)
Again, we don’t want deaths so we view this as a positive.
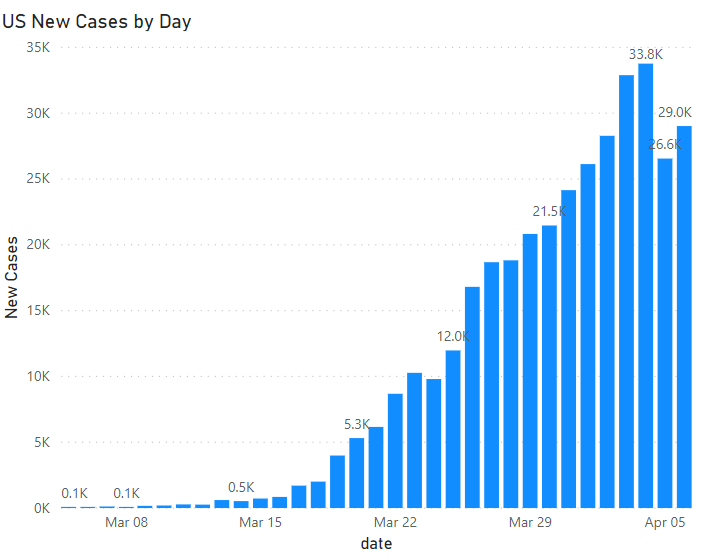
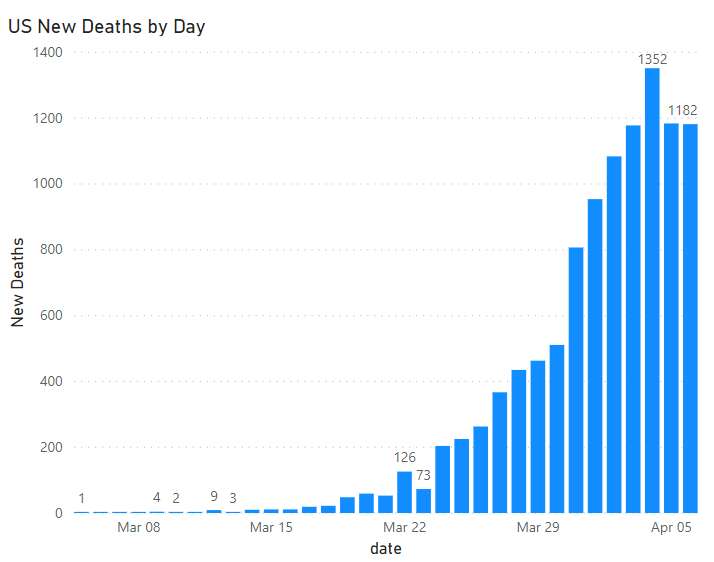
US new cases of COVID-19 and new deaths are both down from two days ago. We want to see more data before we call it a trend, however, with the, moving very similarily we are optimistic.
Tennessee is moving in the wrong direction as far as new cases go. Deaths (not shown) remain steady so it is possible that this is the case of more or better testing rather than an actual expansion of the epidemic.
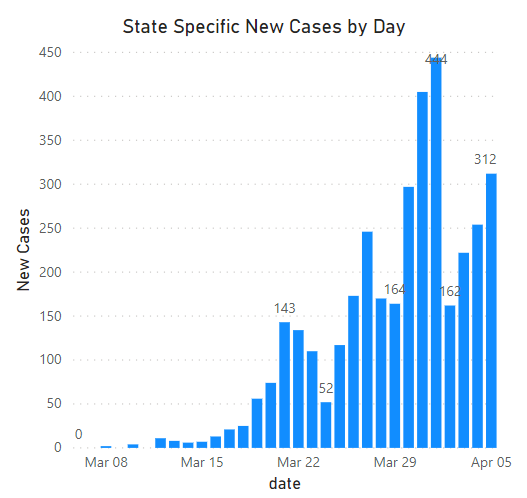
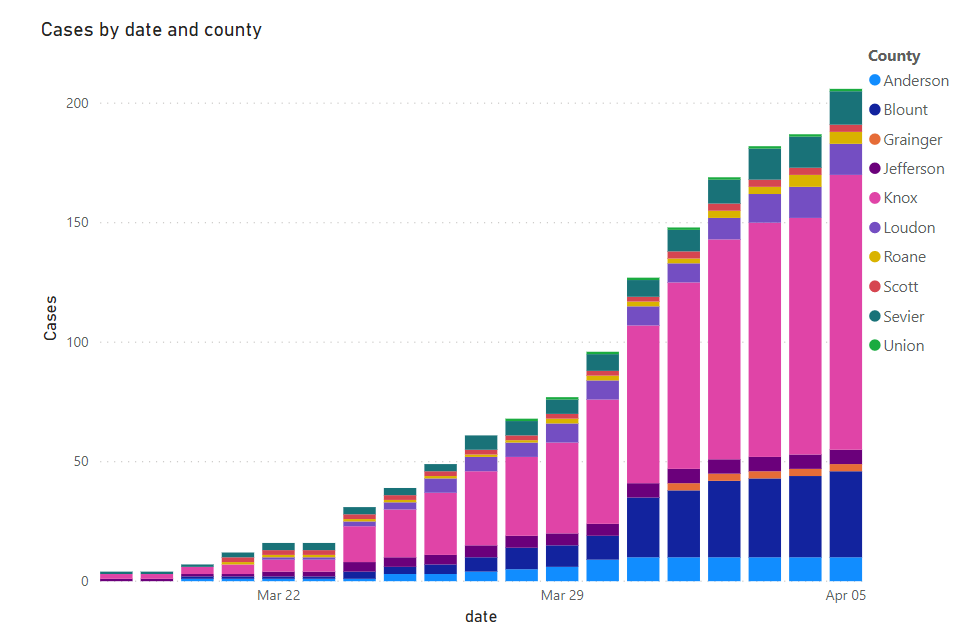
New cases around Knox County continue to mostly flatten. Knox County cases are going to throw this off for the most recent day, but, again, that may be the result of better or more testing, especially with the drive-in testing centers over the weekend. Deaths in all of Tennessee remain very low.
International Numbers
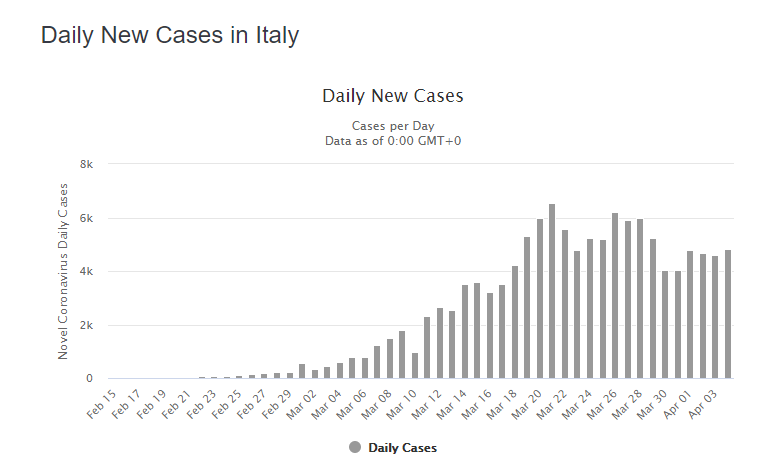
Italy continues to right direction. To us, this is more significant than other European countries because (1) Italy was hardest it, if they can make the right progress we all can, (2) they didn’t social distance well at first, which candidly reflects the US, and (3) they have a more vulnerable population than most countries.
Deaths (not shown) continue to move in the correct direction as well
Germany and Spain are both trending downward. France’s case data looks very noisy, its deaths are largely moving down since April 2nd.
How JM Addington is Adjusting
Financially it is becoming more apparent that we need to be self-reliant on capital in the short-term. While the EIDL and PPP loans may come through we aren’t planning on them to come through when we need the cash and we are creating other plans to cover potential shortfalls over that period.
Masks: we’ve ordered enough fabric and elastic to make enough masks for each employee to have at least two, one for wearing and one that can be washed.
The South China Morning Post in Hong Kong ran an “I told you so,” article on the mask topic. And, well, they did tell the world so. Hong Kong still has fewer cases than Idaho.
Your author has been wearing a fabric mask while in stores for the last two weeks. The goal is mitigation of risk not elimination of risk. Just like washing hands won’t guarantee anything it helps and its easy.

Other
Thanks to those that have shared kind words or liked these posts. We’re doing out best to put out data-driven analysis, each one of these takes about 2 hours. It’s helpful to know that they are being read.
If you want copies of the Excel sheet and PowerBI Reports we use to put these together email us, info@jmaddington.com. Right now, our PowerBI combines data from JHU, NYT, COVID Tracking Project, IMHE and the TN Department of Health. Most sets are updated daily.

Download our Report!
Get your copy of What Every Business Owner Must Know About Hiring an Honest, Competent, Responsive, and Fairly-Priced Computer Consultant.