Today we’re going to talk about the biggest news today, and then go over numbers, which are less encouraging nationally that we’d hope.
Missouri, Italy & France
Early this morning CNN posted an article that a pork processing plant in Missouri had 373 workers test positive for COVID-19 and all were asymptomatic. Now, we’re taking this with a small grain of salt because it goes so far against the other data that we have, the idea that a single cohort could test this congruently positive while asymptomatic is hard to believe, it would necessarily raise a lot of questions about what we know about COVID-19.
A paper in the International Journal of Antimicrobial Agents says that doctors in France retrospectively found a patient that tested positive for COVID-19 on December 27th, 2019. Doctors routinely keep samples at this hospital, so that back-tested some of them against COVID-19 and found one. For context the WHO’s website still states that the first recorded case outside of China was in Thailand, on January 13th.
On March 20th, we wrote:
A little something to watch, one report of out Italy suggests that the Coronavirus was there as early as November or December. If so, that would mean that the virus was circulating weeks before anyone knew it existed and possibly two months before anyone knew it was going to be a big deal.
JM Addington Technology Solutions, 2020-03-20 COVID-19 AM Update
This adds to the possibility that COVID-19 really was circulating in Italy far earlier than confirmed.
It is impossible to go into the implications of these reports, if they pan out, without diving into some pretty deep and poorly-vetted prognostication.
Today there are dire headlines about internal White House projections of deaths per day hitting new peak levels in June, etc. We certainly don’t want to discount that possibility, however, selected leaked White House papers typically do little to further science or an objective understanding of reality. The White House (and the Pentagon) plan for everything. You will find plans in their archives that range from spot-on to absolutely crazy. It will matter if it turns out it was the consensus plan and not a “just a possibility” plan.
J. Crew is going to file for bankruptcy. (1) Bankruptcy doesn’t mean going out of business, (2) the fashion/clothing/retail sectors have been in a bad spot for years, (3) because of (1) and (2) we expect to see more of these filings: it is a “forced opportunity” to take an action that was already likely.
Gap, Tesla and Victoria’s Secret are among the nearly 5,000 store closings already in 2019
CNBC, nearly 15 months ago in 2019
Finally, Tyson says to expect more meat plan closures. We’ve been on this for a couple of weeks now. Please remember that a shortage doesn’t mean an outage.
Numbers
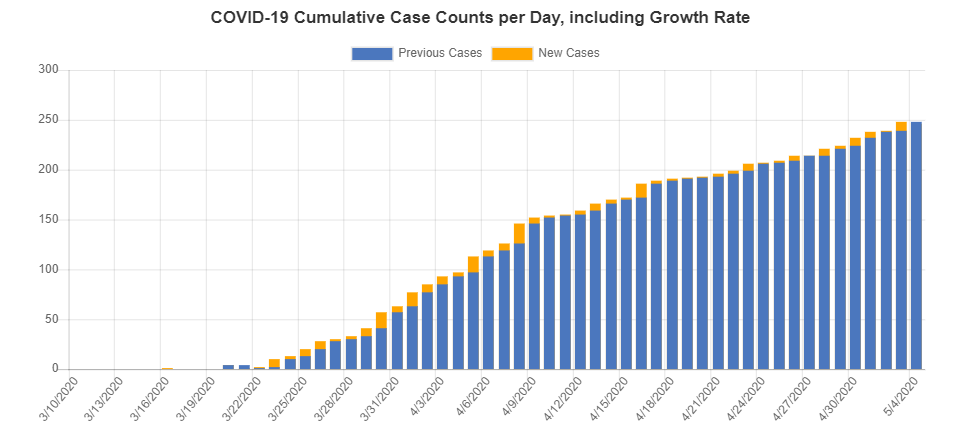
We’re just going to skate over these today because they can be summed up easily: the US declining in cases, but barely. Tennessee is increasing in cases, and that’s looking iffy. The Knox County region sees about the same growth we have seen.
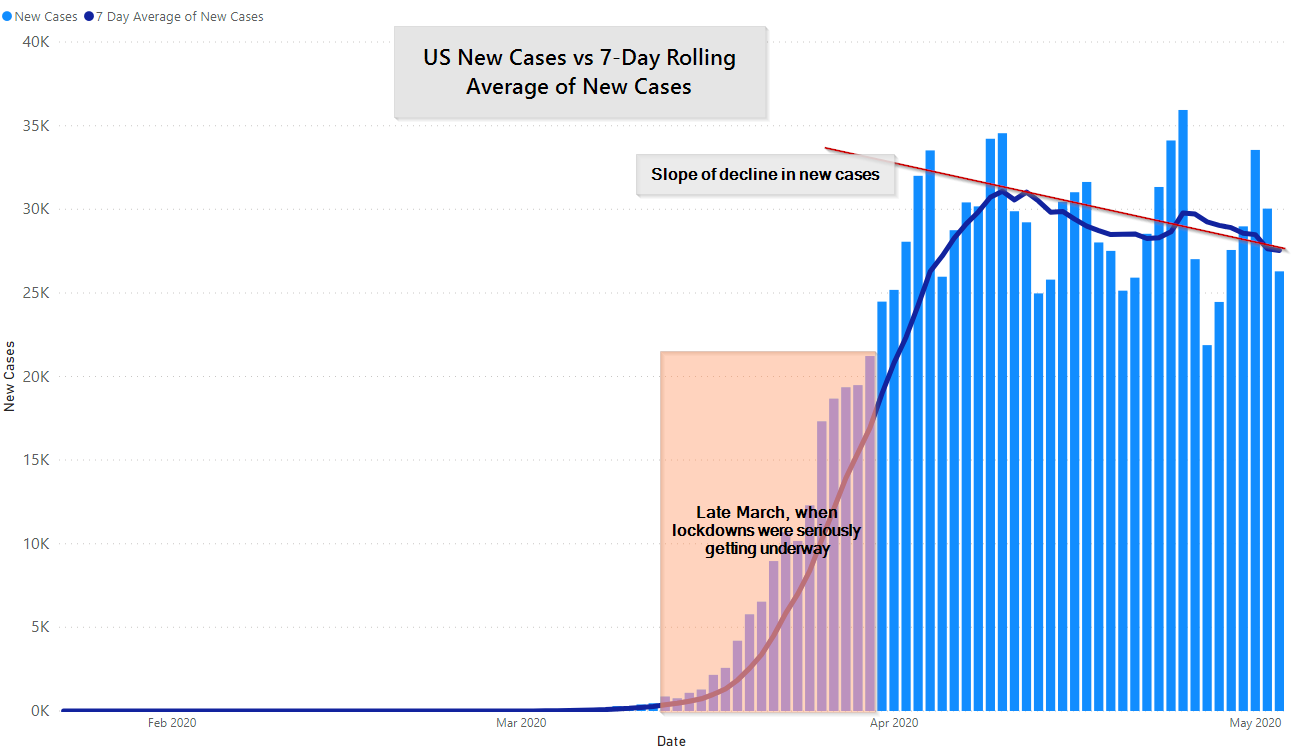
There really isn’t a way to interpret this as a good news, other than that it doesn’t seem like our healthcare system has been overwhelmed on a national level, the avoidance of which was the primary rationale for the lockdowns.
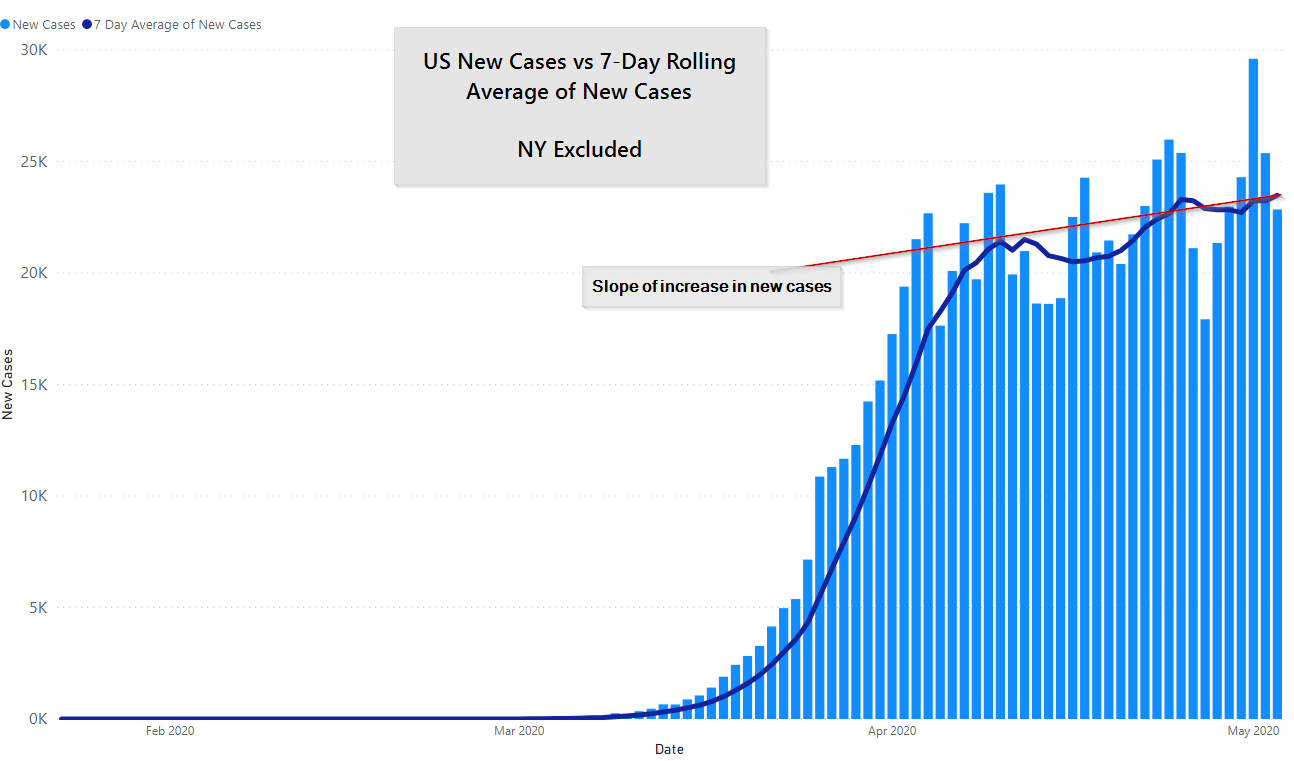
If you remove New York completely, we’re still on the upswing.
Not shown are deaths, which at over 60,000 total are already past the optimistic numbers put out in mid-April as New York began to get its crisis under control but before outbreaks were as prevalent elsewhere. President Trump yesterday put the possible deaths number at as high as 100,000. At our current rate of about 1,700 new deaths/day we’ll hit that before the end of May. It’s really not clear to us how we’d slow down deaths/day if cases are increasing, and are expected to increase more as we open up.
We are switching our source for most Tennessee specific data to the Tennessee Department of Health as they have finally given us data on par with the COVID Tracking Project. Better late than never.
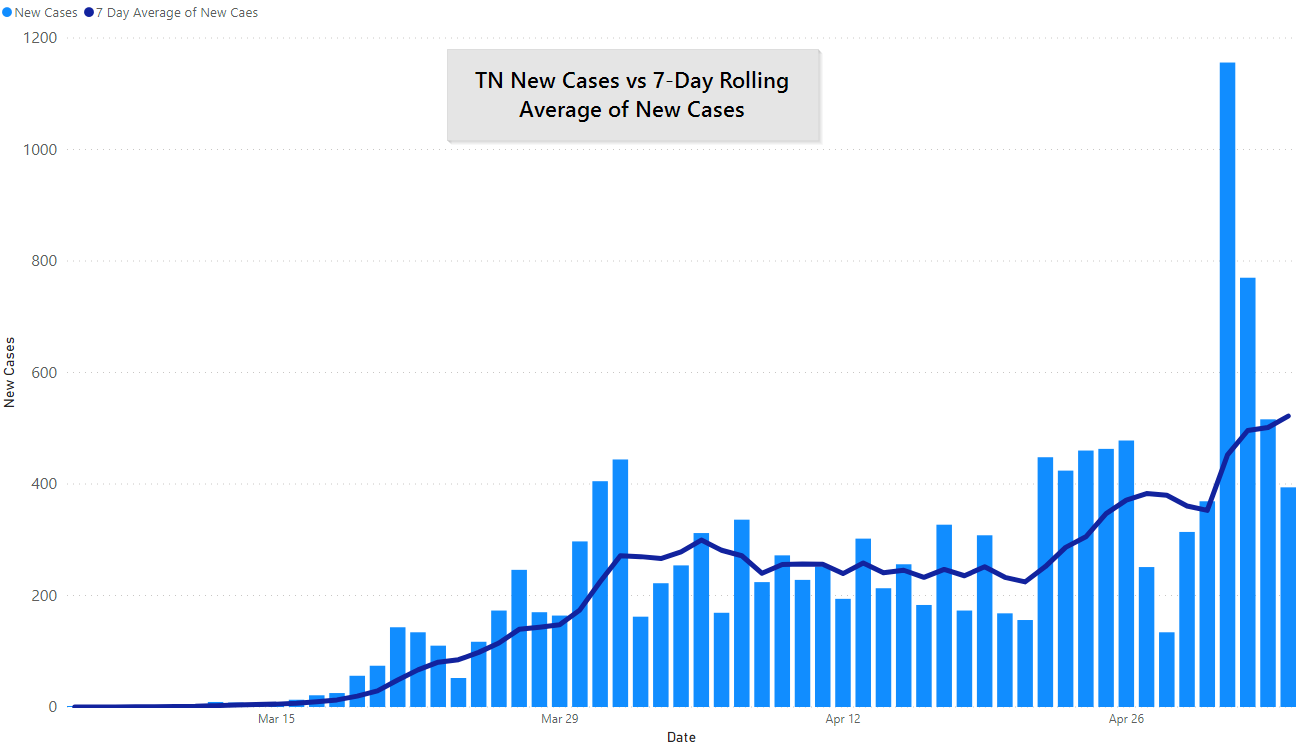
Again, for Tennessee the balance is that things are trending the wrong way, even allowing for the clusters we know about (i.e., prison testing). What does this tell us about opening up? Nothing, right now. These trends most likely reflect exposures in late April, that were tested when Tennessee began to open up. Mid to late May is when we learn about how opening up affects us.
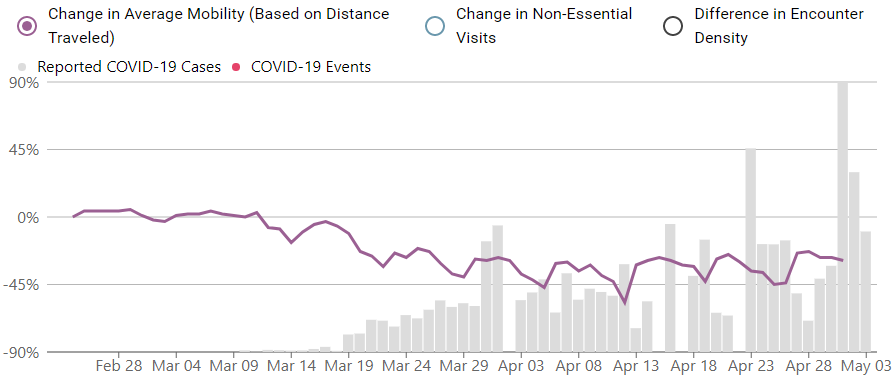
You certainly can read this data as giving you great pause and caution before heading outside your home and that isn’t an unfair reading of the data. However, as we have again noted for weeks, Tennessean social distancing plateaued in early to mid-April.
Of course, even with those caveats, it’s hard to imagine that opening up won’t bring more cases, and deaths.
Knox County remains in its own little world. One of the most important aspects of our low growth in absolute number of new cases today is that our health department has enough to staff to do testing and contact tracing. After you get above a certain point your percentage growth rate can be slow, or even negative, but you still don’t have enough people to fight it. The cat is still in the bag here.
We’re going to leave you this excellent map that focuses on trends a the county level.
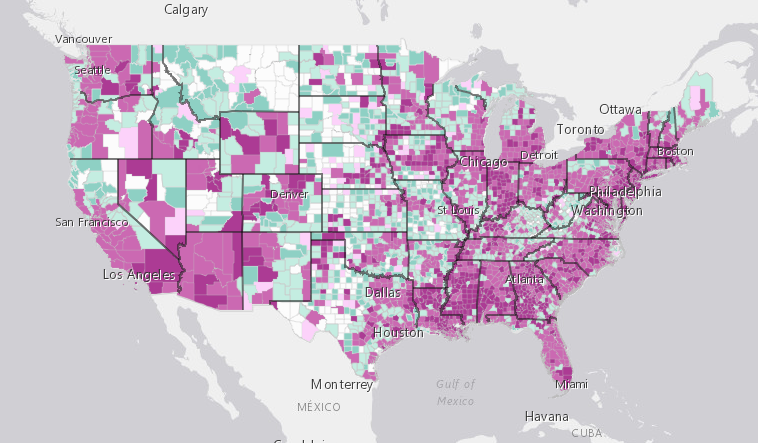
A month ago New York was driving COVID-19 data so much we’d actually show graphs here with and without it. Today, there are a number of states on its heel. The COVID-19 story is about to get much more complex
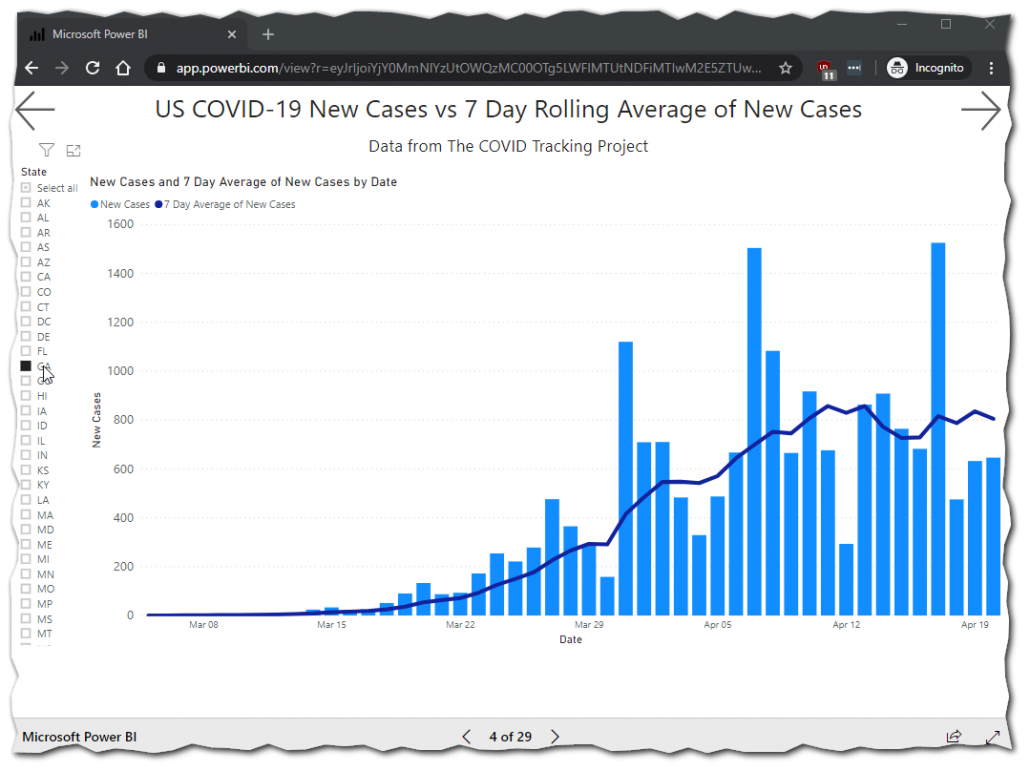
By the way, if you want to see the same graphs for your state click here, we pull nearly all of our own visuals from this report. Typically updated at the same time the evening’s post goes up.
Here are GA new cases.
Also, you can do it on your phone but it is much easier to navigate on a bigger screen.
These posts helpful?
Then go ahead and share them where you saw them once or twice a week.
Get In Touch
Need help thinking this through? Access to more data? Help getting your technology in order to handle what’s here and what’s coming? Contact us today.
[wpforms id=”4995″]Other
Thanks to those that have shared kind words or liked these posts. We’re doing out best to put out data-driven analysis, each one of these takes about 2 hours. It’s helpful to know that they are being read.
If you want copies of the Excel sheet and PowerBI Reports we use to put these together email us, info@jmaddington.com. Right now, our PowerBI combines data from JHU, NYT, COVID Tracking Project, IMHE and the TN Department of Health. Most sets are updated daily.

Download our Report!
Get your copy of What Every Business Owner Must Know About Hiring an Honest, Competent, Responsive, and Fairly-Priced Computer Consultant.