Today we’re going to go over a question we got today, which will be our focus.
If you want to see cases and deaths see yesterday’s post, there are not material changes.
How does increased testing affect New Cases?
We had one question come in asking how increased testing would affect new cases. The expectation by public health experts and JM Addington is that increased testing will lead to an increased number of confirmed cases. In fact, the Knox County Health Department is considering pulling back from some of their events because they aren’t finding enough new cases.
There are two primary reasons that we test in public health:
- To find out if a specific individual is sick. In the case of COVID-19 this would be to ask them and anybody that they have been in contact with to self-isolate to prevent further spread
- To find out how widespread a disease is in a community or geography (city, county, state, prison, hospital, nursing home, etc.)
Clearly if you test more you are going to find more so the question becomes how much testing is enough and at what point does your level of concern go up?
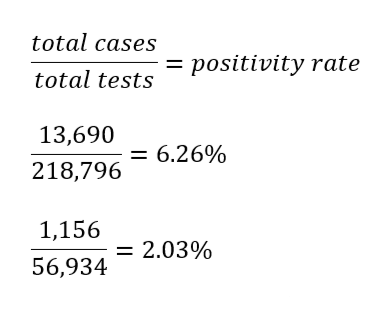
One of the simplest ways is to look at the positivity rate, the number of total cases divided by total tests. In short, the positivity rate will give you an idea of (1) if you are doing enough testing, and (2) if the disease is spreading regardless of the number of confirmed cases. Both Dr. Fauci and Dr. Gottlieb have said the that US should shoot for a 10% rate. (See this article for a more in-depth discussion)
The typical way to calculate this is to take total cases, ever and divide by total tests, ever. For Tennessee, we get a 6.26% positivity rate.
We’re going to admit to playing armchair epidemiologist here and show you how we look at it, which is to look at the last 7 days of new cases and divide by the last 7 days of tests, which gives Tennessee a 2.03% positivity rate.
The US has a total positivity rate of 15.84% and 7-day positivity rate of 10.85%.
The first metric — total cases/test — will bias your rate towards whenever you had the most cases and the most testing, so you may end up measuring more where you were than where you’ve been. Taking a more recent set of data will tell you about where you are now.
We’re going to show you this data for the last 3 weeks, then we’ll talk about using it in conjunction with two other important metrics.
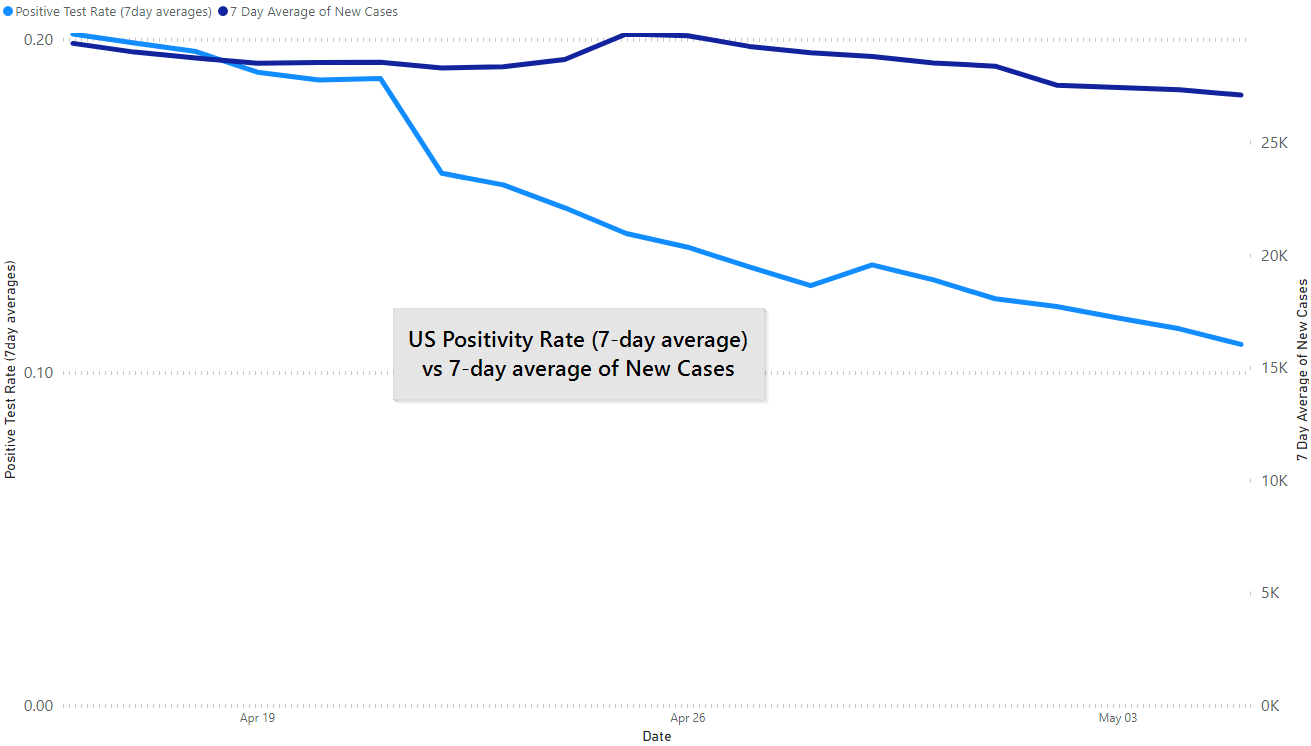
Note the y-axis changes scale here
The relatively low positivity rate in Tennessee is one of the reasons we’ve said that the data in Tennessee supports re-opening.
Of course, the positivity rate can be gamed: if you test a bunch of people that are not sick it will go down. The real question is how is the positivity rate moving with the total number of tests, the number of new cases and the number of new deaths?
You must combine data points to to look for the trend. These data points are cardinal directions, north vs south, not specific headings, 357′ vs 356′.
If cases are going up but the rate and deaths are stable or declining then it is likely you are simply doing a good job testing and the situation is stable or improving. If the rate is high, and stable or increasing then an outbreak may be getting ahead of you. If deaths, cases and positivity rate all increasing you’re in a world of hurt.
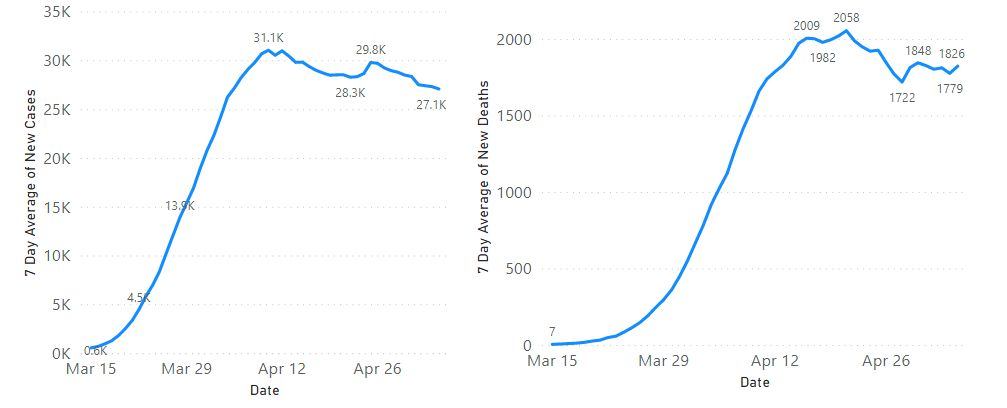
In a perfect world you will see cases, deaths and positivity rate all trend down as the situation improves. Nationally, the positivity rate (see above) is dropping faster than new cases or new deaths per day, which would be indicative that our testing is getting better but the situation is still static overall.
Source: Data from The COVID Tracking Project; Chart by JM Addington
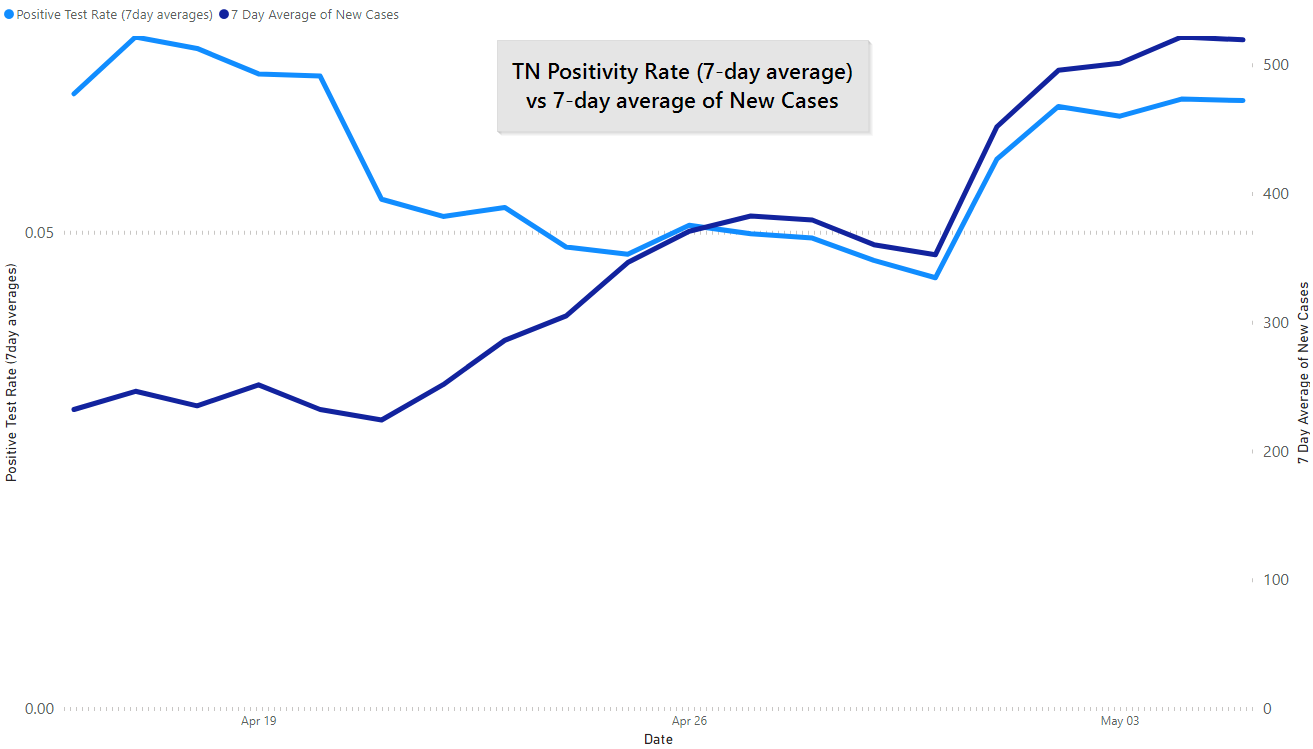
In Tennessee, you see news cases per day jump mid-April and then plateau to where we are today, along with deaths. With a rising positivity rate this would be indicative of the situation worsening overall, if only slightly at this point.
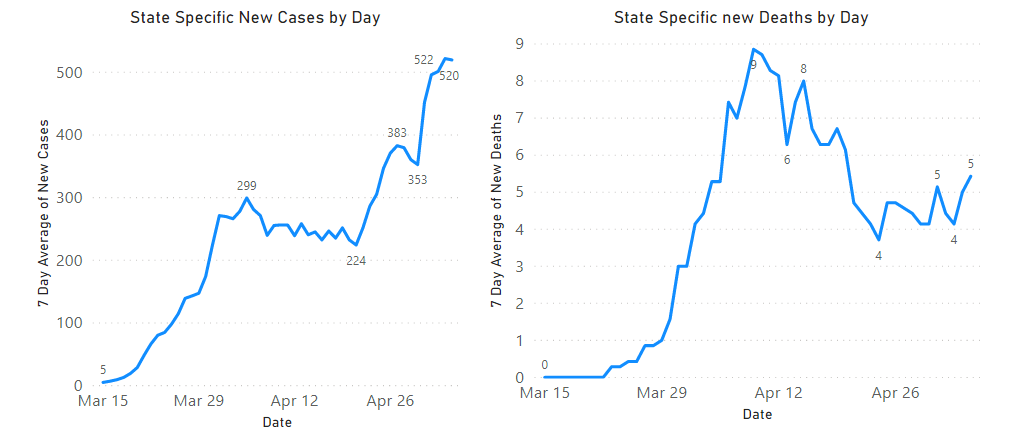
Source: Data from The COVID Tracking Project; Chart by JM Addington
…but…
Even all of these numbers together don’t do a good job at telling the story anymore. If anything, they are just enough to give you an arrow indicating direction.
Tennessee is testing all prison populations this week and already began testing all long term care facilities, both populations that have a lot of cases. So your tests and your positivity rate are going to go up because of the more targeted tests. This doesn’t mean that community-wide transmission has changed.
For better or worse, we think that this is going to increasingly be the case across the nation. Even the most in-depth numbers you have on testing, cases and deaths will only tell you part of the story. We’re not sure how keeping up with the numbers alone can be useful.
News
Building on yesterday’s news of a patient in France retrospectively being tested with COVID-19 on December 27th, 2019, is now bolstered by a peer-reviewed study showing that COVID-19 was circulating widely earlier than initially believed.
Tennessee is finding large amounts of asymptomatic cases in its prisons. Public Health Commissioner Dr. Piercey acknowledged as much during the briefing today but didn’t add any color to it. Combined with yesterday’s story of similar testing in a meatpacking plant, it challenges some of what we believe to be true about COVID-19.
Zoo Knoxville is set to re-open May 18th.
A Knoxville firm, one of Tom Boyd’s, is working on COVID-19 antibody testing.
Governor Bill Lee announced that Tennessee has procured 5,000,000 cloth masks and will be distributing them, free, via public health departments (from today’s briefing).
Infrared thermometers are available for Tennesseans only at tennesseepledge.com, $33/ea.
Dentists are allowed to open in Tennessee’s 89 rural counties, tomorrow.
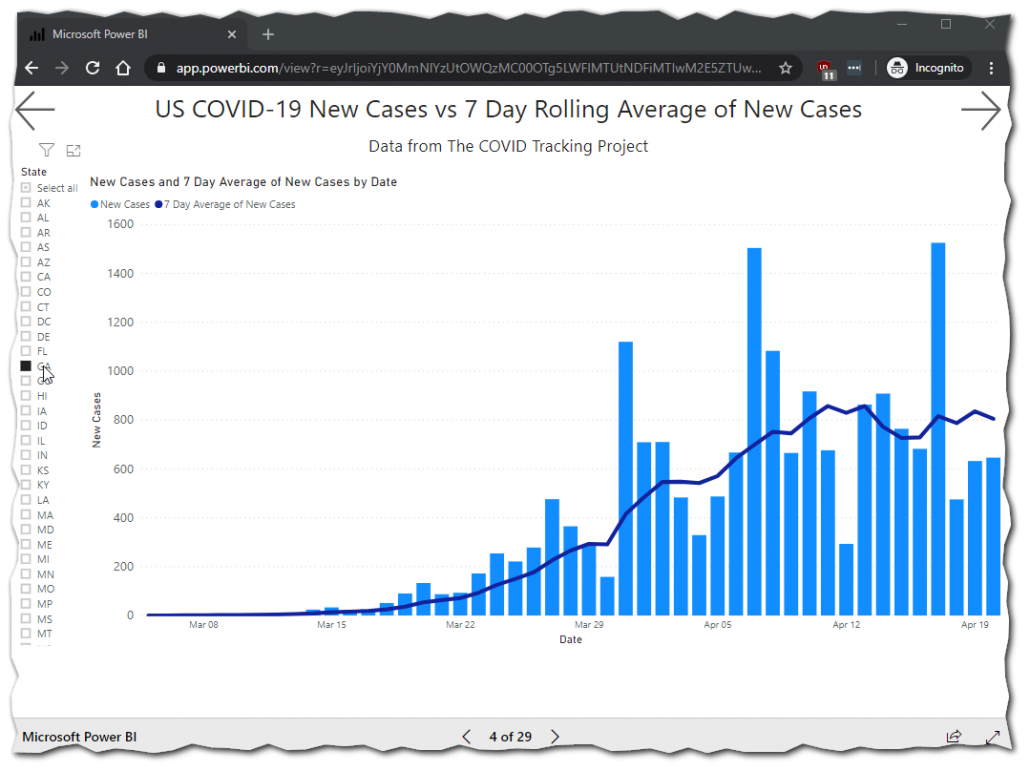
By the way, if you want to see the same graphs for your state click here, we pull nearly all of our own visuals from this report. Typically updated at the same time the evening’s post goes up.
Here are GA new cases.
Also, you can do it on your phone but it is much easier to navigate on a bigger screen.
These posts helpful?
Then go ahead and share them where you saw them once or twice a week.
Get In Touch
Need help thinking this through? Access to more data? Help getting your technology in order to handle what’s here and what’s coming? Contact us today.
[wpforms id=”4995″]Other
Thanks to those that have shared kind words or liked these posts. We’re doing out best to put out data-driven analysis, each one of these takes about 2 hours. It’s helpful to know that they are being read.
If you want copies of the Excel sheet and PowerBI Reports we use to put these together email us, info@jmaddington.com. Right now, our PowerBI combines data from JHU, NYT, COVID Tracking Project, IMHE and the TN Department of Health. Most sets are updated daily.
[1] We are simplifying. This article goes over the accuracy in more detail and proper terminology. There are serological tests claiming higher accuracy but we haven’t seen any that have passed through peer review at those higher levels of accuracy.
Download our Report!
Get your copy of What Every Business Owner Must Know About Hiring an Honest, Competent, Responsive, and Fairly-Priced Computer Consultant.