First, we will go over the top two COVID-19 views we believe are being left out of the public discussion, second, hit national and regional headlines and finally go over numbers.
If this page is too long for you, read until “News” and stop there.
One Theme in Two Areas
The public discourse this week is starting to look at the longer view of COVID-19 in both health terms and economic terms. The most balanced view and, we believe, most correct view is that these are intractably the same thing. The worse the health outcome, the worse the economic outcome. (If you haven’t read our post from Sunday that goes over three major COVID-19 scenarios we’d encourage you to visit that section now.)
This week we’ve seen Dr. Fauci warn that states that “skip over” opening criteria risk longer-term setbacks. Dr. Fauci has been nothing if not consistent in articulating this, here he is three weeks apart discussing states skipping steps as they open up:
This should be viewed as an economic setback as much as a health outcome. This isn’t crazy talk, the official criteria boil down to, “COVID isn’t getting worse and your state’s healthcare system can handle the cases;” if COVID is getting worse and your healthcare system can’t handle how can you actually expect the economy to produce?
Today, the chair of the federal reserve cautioned that, “the recovery may take some time to gather momentum,” which is economist speak to say that things are going to be bad for awhile. How long and how bad? That’s still hard to say, “the scope and speed of this downturn are without modern precedent…”
“Without modern precedent,” is a statement we 100% agree with: modern economics more or less date back to the founding of America and the modern economy with globalism, worldwide capitalism, interlinked economies, etc., dates back decades not centuries. So for as much as COVID-19 is the first modern health pandemic of this scope and size, so is the economic downturn.
So, to the extent that we can’t get COVID-19 under control both nationally and globally we’re going to have trouble getting the economy going.
The best COVID-19 current models have things getting better, but very, very slowly. We had a steep tick up, like a roller coaster climb, but we are missing all of the dramatic fall.
We’ve said before and we’ll say it again: we’ll all get through this, this isn’t likely to turn into the next Great Depression. But getting a handle on COVID-19 sure would put us in a better economic state.
Economic Data
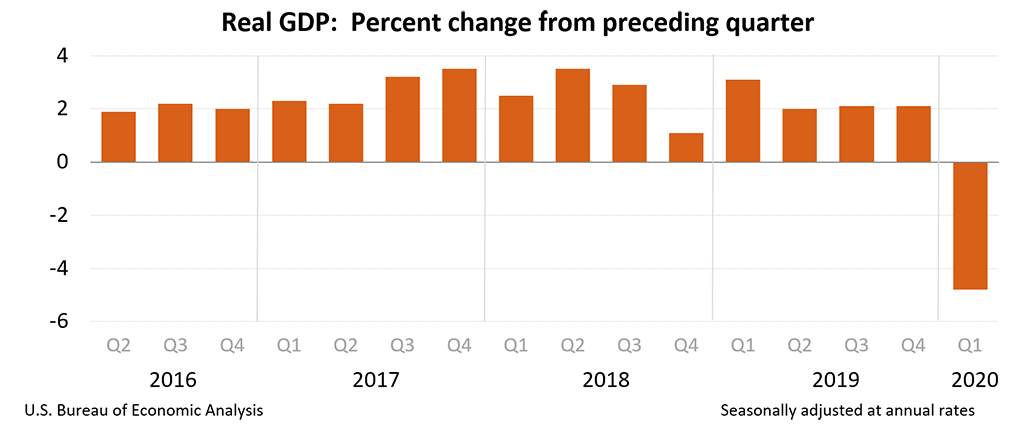
We hit unemployment Sunday, and it’s bad, at nearly 15% with the real number likely closer to 25%. Quarter one GDP (overall economic activity) dropped nearly 5%, assuming that most of the drop occurred in March as stay-at-home orders first hit we’re probably looking at a 15% decline in economic activity inside a single month.
Tennessee released revenue figures for April, yesterday, May 12th. These figures largely reflect changes in March as March sales generate April income in taxes. (As a business, any sales tax we collect has to be paid by the 20th of the next month.) Sales tax, specifically, is down 6% from a year ago
Keep in mind that economic data lags real life, so it is likely that we’ll see the worst economic numbers at the same time we’re seeing the best health numbers.
News
Tennessee is going to lead our news today. First, Vanderbilt came out and updated their COVID-19 report for Tennessee. Here are the top takeaways and our brief analysis:
- Hospitals are not above capacity: Keeping the healthcare system inside capacity was the biggest driver of lockdown, so this is critical.
- Tennessee is either plateaued or barely declining: This is mostly good. However, the decline is so slight that we don’t have room to mess it up right now.
- Their first report was overly pessimistic: Modeling is hard when you deeply understand the disease and have great data. No one in the world has more than 5 months of experience with COVID-19 and 6-10 weeks of data is not a lot of data for modeling. The Vanderbilt team has done a great job using their expertise, staying humble about what they know and being transparent about what has changed.
May 8th, the Tennessee Lookout reported that police and sheriff’s offices across the state have access to the names and addresses of people have who have tested positive with COVID-19. Yesterday, the City of Knoxville quickly discontinued the practice of receiving this information from the state while the Knox County Sheriff’s Office doubled down.
This is not one of the things Tennessee is getting right.
- Law enforcement should be treating every encounter as if it is with a COVID-19 positive person
- It doesn’t help Governor Lee’s mantra of, “if in doubt, get a test”
- It is likely to discourage testing among some communities where testing is needed most
I still believe in having access to that list. I think it has huge benefit… But… I think if it kept people from getting tested it was not worth it.”
Eve Thomas, Knoxville Chief of POlice
Thailand, the second country to deal with COVID-19, has no new cases today. Thailand has a population of nearly 7 million and has recorded only about 3,000 COVID-19 cases, a quarter as many as South Korea and about a fifth as many as all of Tennessee.
A new study on hydroxychloroquine, from New York City, shows it to essentially be ineffective for COVID-19.
Numbers
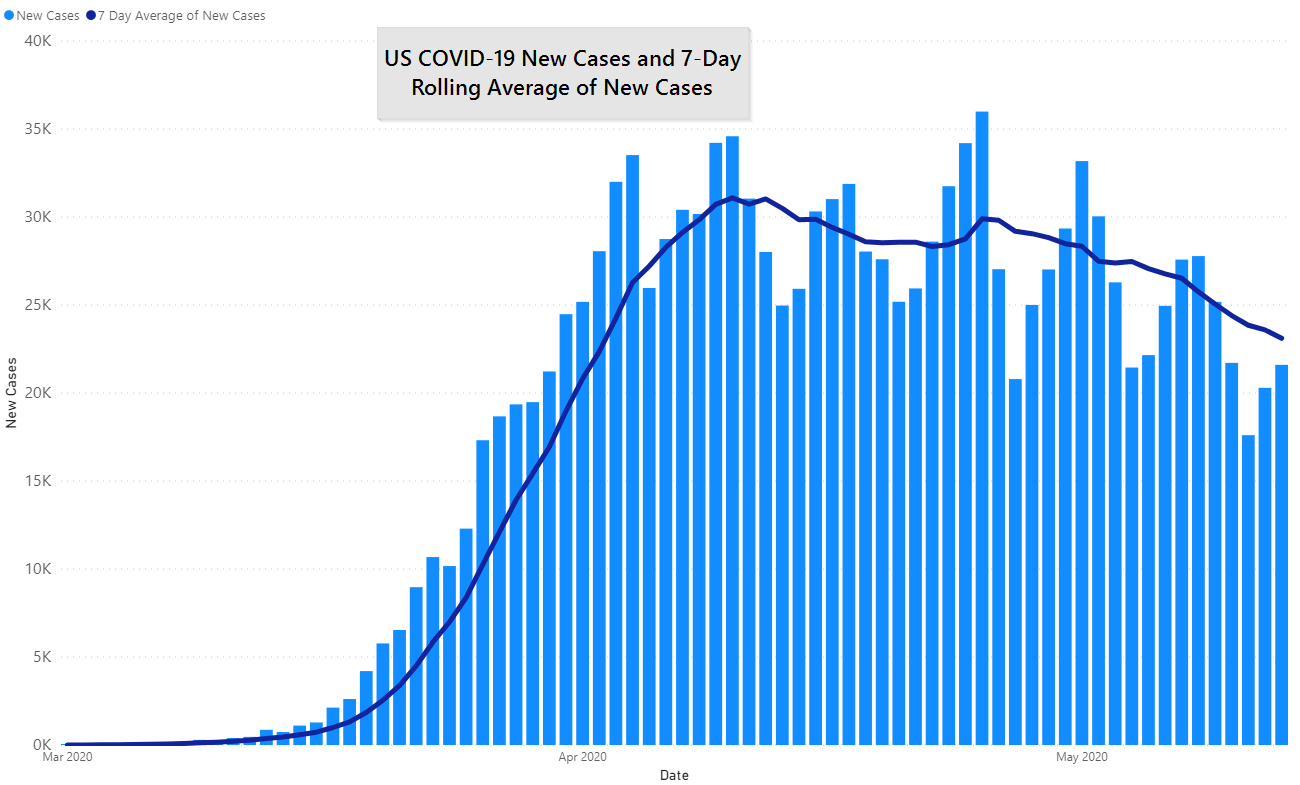
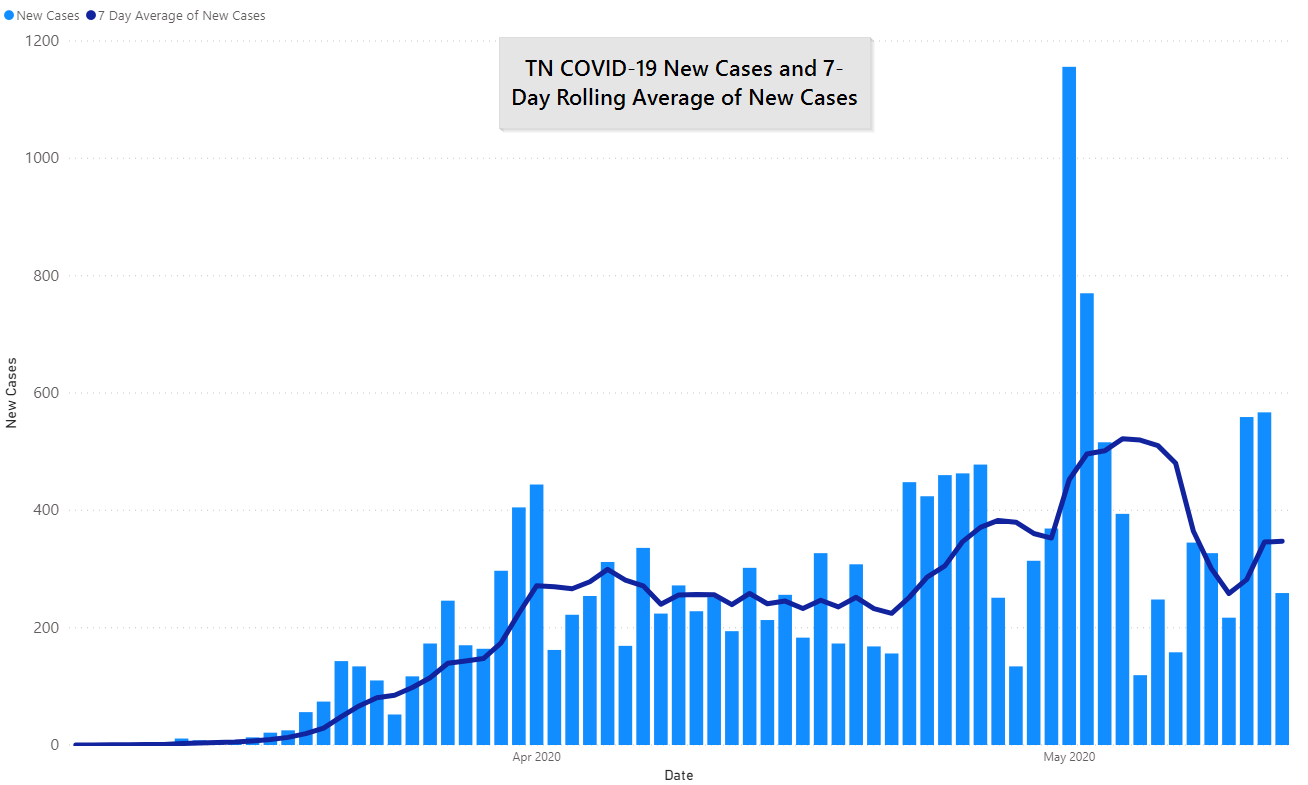
Numbers are not materially different from Sunday, so we are just going to show two charts, national cases and Tennessee. While the US continues to show a downward trend in new cases it continues to be a very slight decline discounting New York. Adjusting for the results from mass prison testing, Tennessee is essentially flat over the last 6 weeks (unadjusted data shown).
What Happened to the IMHE Model?
That seems to have quickly fallen out of favor with many (most?) medical professionals. It overestimated deaths on the way up and underestimated them on the way down. We’ll show you how their second round of modeling did, but, at this point, don’t see a reason to continue to reference it. That said, IMHE has also done a world-class job in modeling transparency around their modeling, we just believe that there are better models out there right now.
The pink line should be tracking the middle blue line:

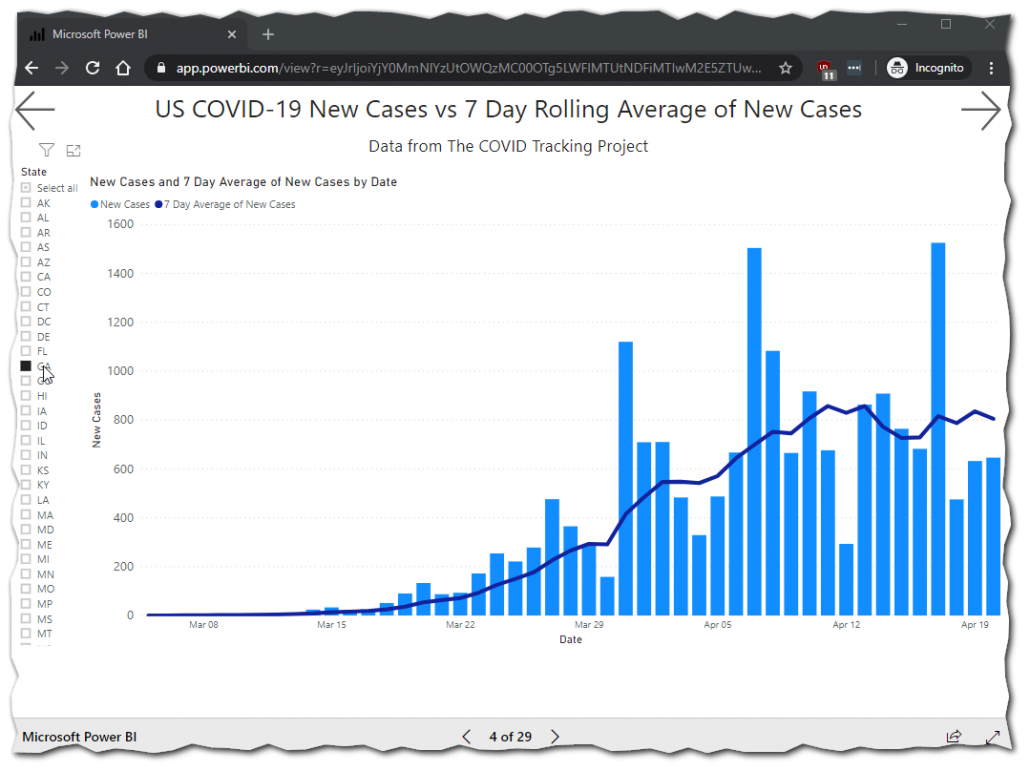
By the way, if you want to see the same graphs for your state click here, we pull nearly all of our own visuals from this report. Typically updated at the same time the evening’s post goes up.
Here are GA new cases.
Also, you can do it on your phone but it is much easier to navigate on a bigger screen.
These posts helpful?
Then go ahead and share them where you saw them once or twice a week.
Get In Touch
Need help thinking this through? Access to more data? Help getting your technology in order to handle what’s here and what’s coming? Contact us today.
[wpforms id=”4995″]Other
Thanks to those that have shared kind words or liked these posts. We’re doing out best to put out data-driven analysis, each one of these takes about 2 hours. It’s helpful to know that they are being read.
If you want copies of the Excel sheet and PowerBI Reports we use to put these together email us, info@jmaddington.com. Right now, our PowerBI combines data from NYT, COVID Tracking Project, IMHE and the TN Department of Health. Most sets are updated daily

Download our Report!
Get your copy of What Every Business Owner Must Know About Hiring an Honest, Competent, Responsive, and Fairly-Priced Computer Consultant.