Today’s post: Mostly news, fast numbers.
Today is mostly a news day. The headliner of the day is definitely the jobs report, showing that unemployment went down in May instead of going up. This was pretty shocking. Nobody seems to disbelieve it, but we can’t find anyone who saw it coming.
We sure didn’t.
EIDL loans are still being processed for those who were already in the pipeline. We got our final confirmation today. The loans are currently capped at $150k.
Congress has passed some changes to the PPP loan. For those not familiar with it, this is a loan aimed at small businesses. Basically, a small business can get 10 weeks worth of payroll money and have it all forgiven as long as 75% of that loan was spent on payroll in 8 weeks. The intended effect was to keep employees on payroll and off of unemployment.
The new guidelines drop the 75% down to 60% (really important for some industries, like restaurants) and allow up to 24 weeks to use the money. At JM Addington we were actually scrambling to find ways to make sure that we used 10 weeks worth of payroll monies in 8.
Medicine for COVID-19 fall into one of two camps: prophylactic (prevent an infection) and therapeutic (treat an infection).
The NIH’s “Operation Warp Speed,” project, aimed at rapidly developing a COVID-19 vaccine, has announced that there are currently 5 candidates. One of these is already in phase 2 trials of which is typically 3 phases. Most of the sources we are tuned into expect that more than one vaccine will eventually be available and, necessary. In all likelihood, there will be no single vaccine safe for all 8 billion people on earth or capable of being manufactured that quickly.
For context, there are over 130 COVID-19 vaccines under development wordwide.
Hydroxychloroquine was seen as a potential therapeutic early on but evidence is quickly showing that it is not effective This week has also seen news: one study that showed it caused harm was retracted while another simply showed no benefit. Remdesivir, in contrast, has been shown to help treat COVID-19.
We also spent time this week listening to Dr. Osterholm and his take on the inflammatory syndrome seen in some children who have had COVID-19. Here are the two takeaways: first, it’s really rare. Second, it’s very similar to other inflammatory issues that we’ve seen follow virus infections for decades.
With news out of the way we’ll take a look at numbers but we are going to be brief today.
Numbers
Last week we say an uptick in cases for the first time since April. That trend hasn’t changed much, having only slightly backed off. We’ve highlighted 20k-22.5k cases/day to give you an idea of the range we’re simply sitting in.
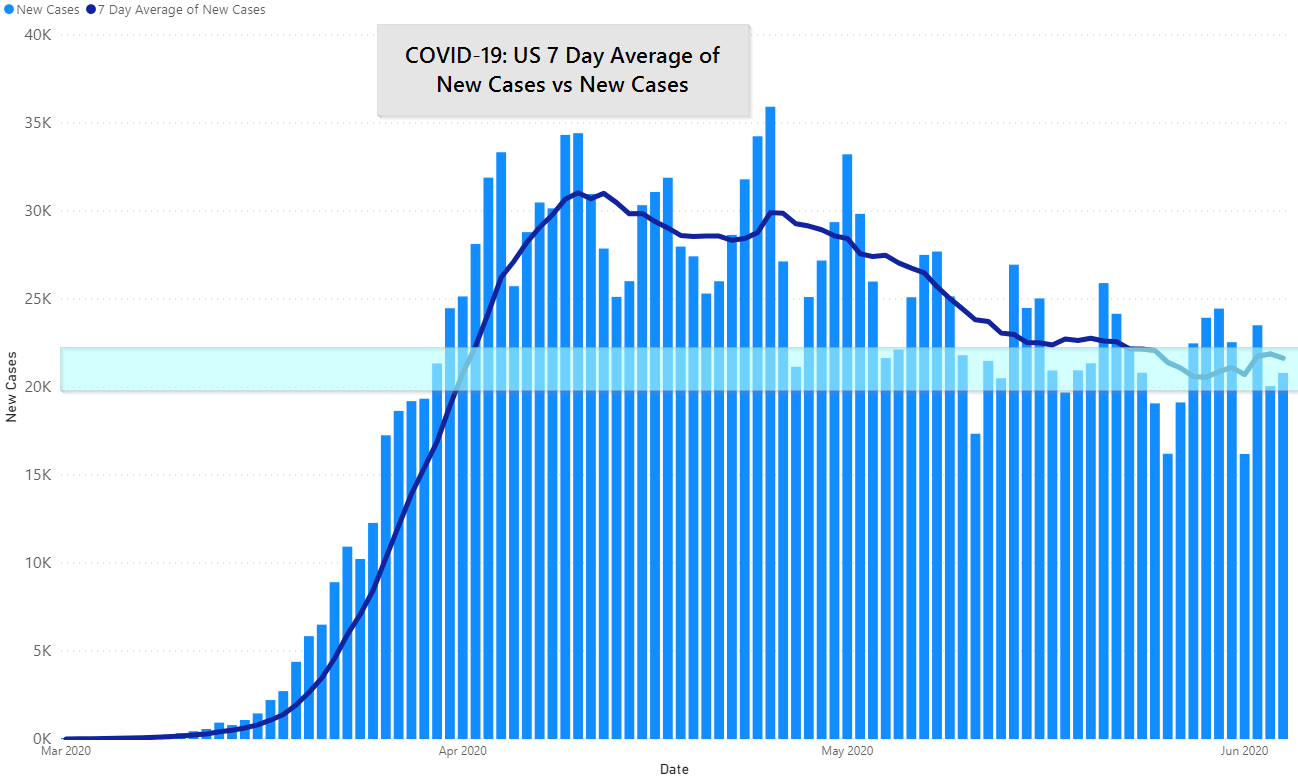
Current events are most likely impacting the data: Minnesota has seen cases drop precipitously since May 23rd, when they were previously rising. This most likely reflects either a lack of testing, or a slow down in the time it takes to get results due to protests and riots going on there.
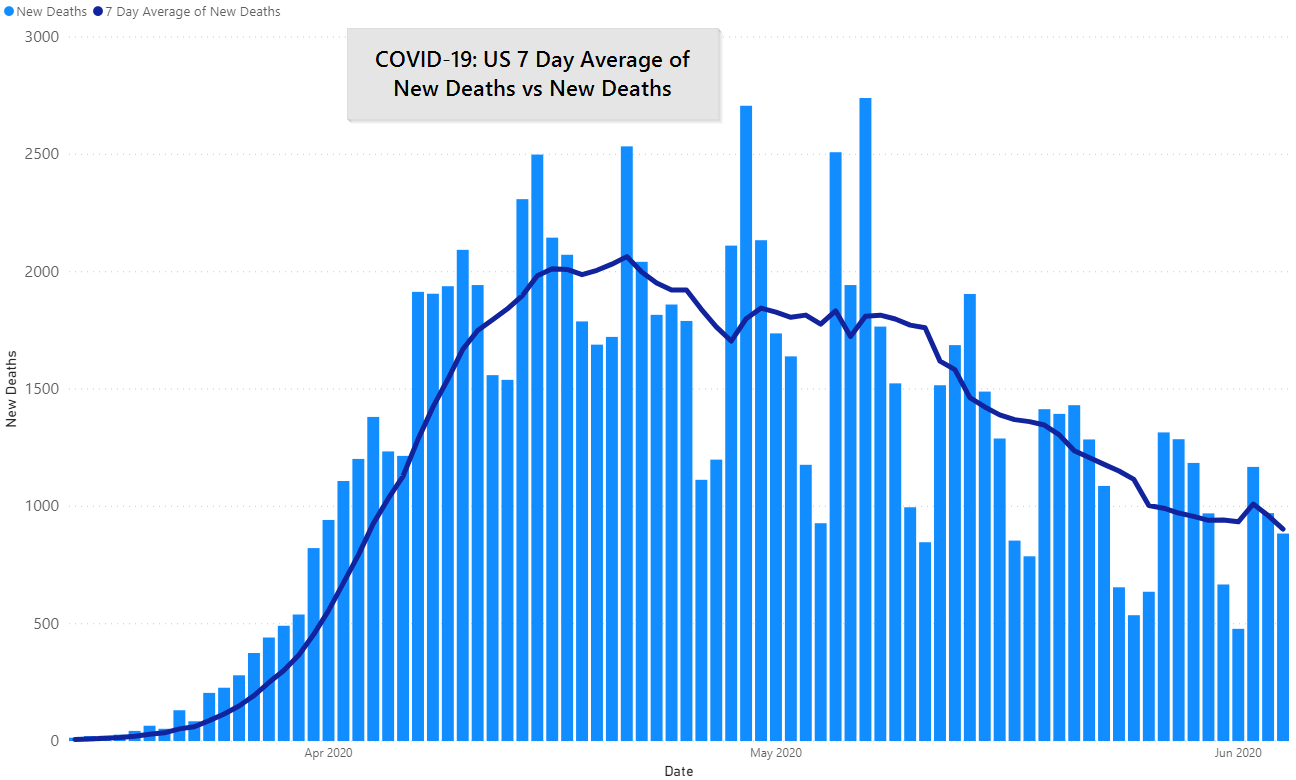
Deaths continue on a slow, downward trend. We are almost exactly at the 50% mark from the peak, which holds true even if New York is removed.
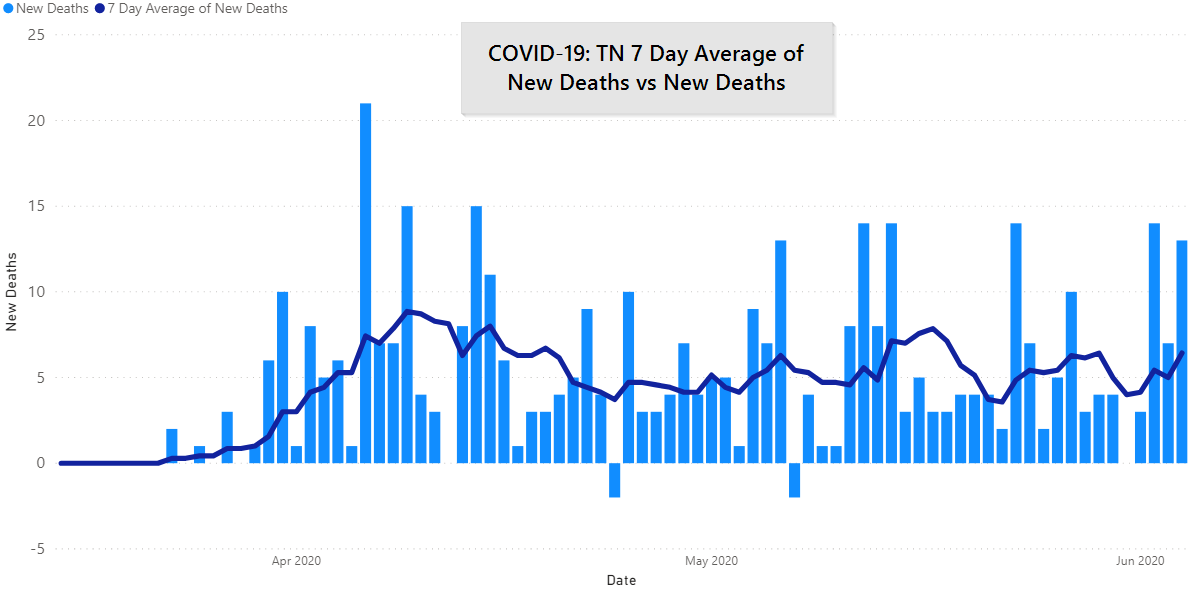
Tennessee also continues to trend upwards. Our new daily cases (average) at the April low point were 224/day, today they stand at 492/day.
To repeat a point from April, this is one reason we really don’t like focusing on the growth rate (new cases divided by total cases) because it can distort the overall picture: we’re at double new cases/day compared to several weeks ago.
We don’t know what is driving the increase. The state no longer holds regular briefings on COVID-19 and our state and local media aren’t digging deep into the topic. (We’d love a hookup with KCHD or TDH communications, if anyone reading this can help.)

If there is a bright spot it is that our deaths have remained very steady and relatively low.
Regionally, cases also continue to rise. Today’s average represents the highest we’ve seen yet.
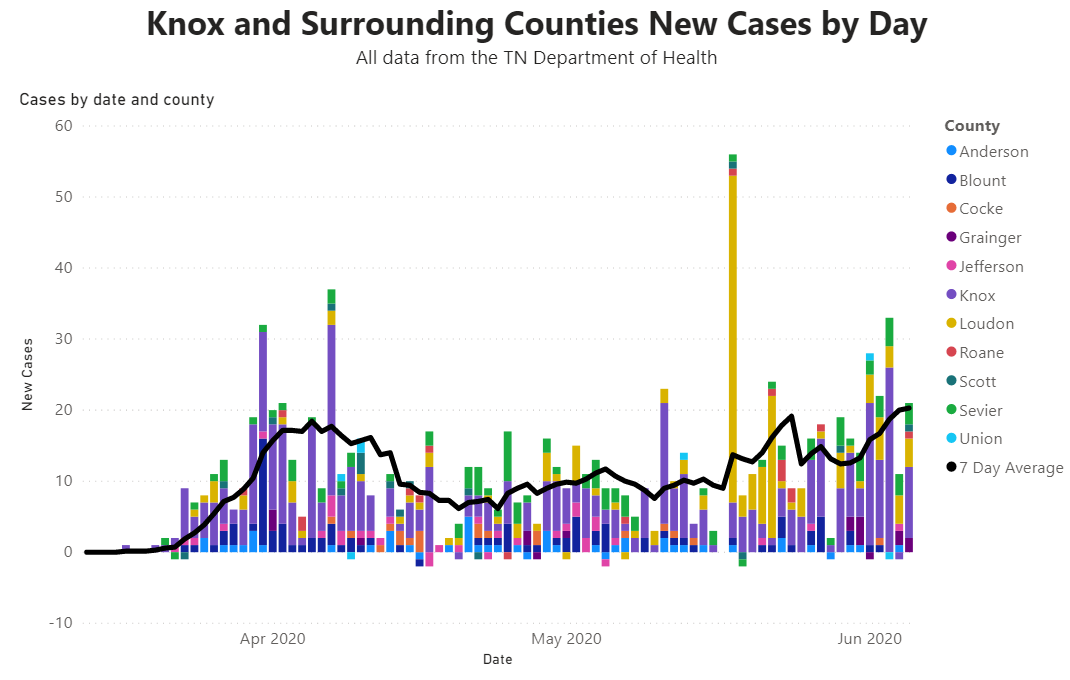
Knox County, specifically, is basically in the same place as our previous peak. Approximately 25% of all Knox County COVID-19 cases are from the last 14 days. 20% of all Knox County cases, ever, are currently active.

Testing turn around times are still above 3.5 days and regionally our non-surge ICU bed capacity is at 34, or 12.5% of available beds.
KCHD has said in their briefings that there are more clusters being found, however, they certainly haven’t stated that this is what is driving the increase in cases.
How JM Addington is Adjusting
Our internal response plan calls for a change to a more conservative posture at 75 new cases per week in Knox County. We are treading that line, however, we believe that enough of the new cases are attributable to clusters outside of our typical contact zones that we haven’t made that move. If the upward trend continues for a few more days we’ll move forward with the more conservative stance.
Get In Touch
Need help thinking this through? Access to more data? Help getting your technology in order to handle what’s here and what’s coming? Contact us today.
[wpforms id=”4995″]Other
Thanks to those that have shared kind words or liked these posts. We’re doing out best to put out data-driven analysis, each one of these takes about 2 hours. It’s helpful to know that they are being read.
If you want copies of the Excel sheet and PowerBI Reports we use to put these together email us, info@jmaddington.com. Right now, our PowerBI combines data from NYT, COVID Tracking Project, and the TN Department of Health. Most sets are updated daily

Download our Report!
Get your copy of What Every Business Owner Must Know About Hiring an Honest, Competent, Responsive, and Fairly-Priced Computer Consultant.